The night at a glance
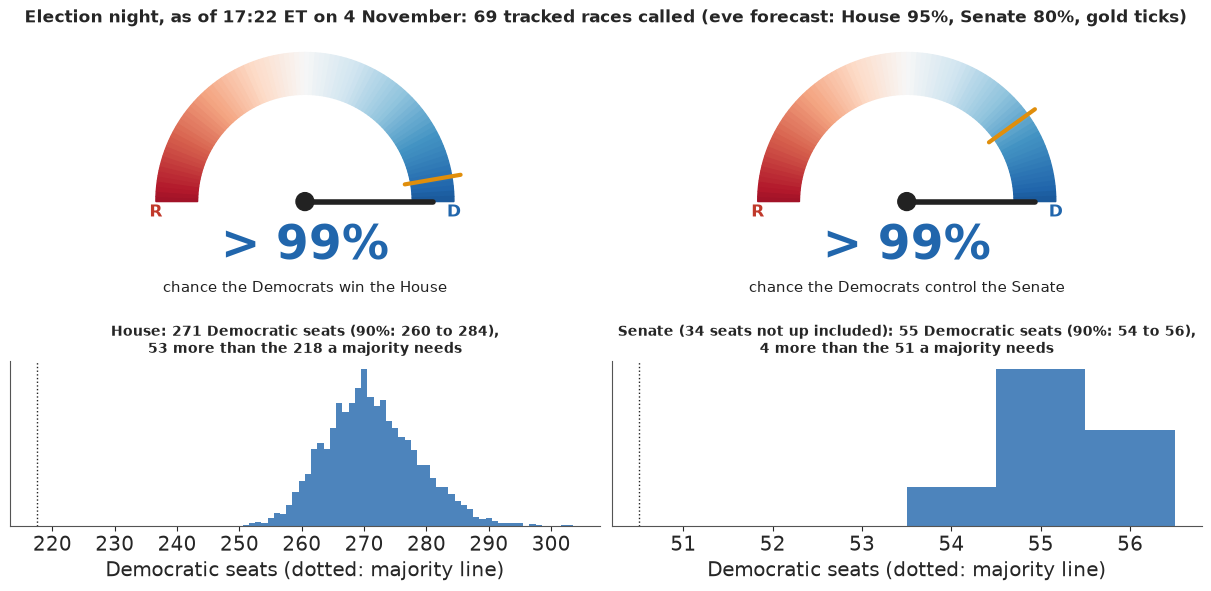
The gauges show the chance that the Democrats win each chamber at the latest snapshot of the night, from the refitted model; the gold tick is the frozen eve forecast. Below each gauge is the distribution of Democratic seats, coloured by which side of the majority line it falls on. They are drawn at the end of the run and placed here.
from IPython.display import Markdown, display

GLANCE = display(Markdown("*The gauges are drawn at the end of the run, from the latest snapshot.*"), display_id=True)
The setting
E94 froze a forecast of the 2026 midterms on the afternoon of election day: 237 Democratic House seats with a 0.94 chance of a majority, and 52 Democratic-caucus Senate seats with a 0.78 chance of control. Then the polls closed, and the calls began. Each call settles one race, but it also says something about all the others. Every race in the forecast shares one national environment and one polling error, and the races in a state share a state effect, so a Democratic win in Florida's 25th district is evidence about Ohio's Senate race. This notebook follows the night as it happens: after each new batch of calls, what changed, where, and why.
The tool is Bayes' rule applied to a forecast that already exists: the frozen posterior is the prior, and each call is a new observation. Election-night models do this (the New York Times "needle" updates from precinct returns; Cohn 2016), and it is the same idea as the nowcasts from partial data in E38 and E90. Two things make it a lesson rather than a lookup. A call is not a margin: it says only that the winner is far enough ahead for the AP to be sure. That is an interval on the margin, and its likelihood needs care. And there are two ways to update. Importance reweighting keeps the frozen draws and weights each by the likelihood of the night's results; it is instant and exact, but it fails when the results are surprising. A refit adds the results to the model and samples again, which takes half a minute here. We use the first for quick questions and the second for the answers.
The notebook is rebuilt through the night as calls come in. Every number about the night (tables, figures and the bulletin at the end) is computed from the call log; the prose describes the method, the frozen eve, and the patterns that do not depend on which calls have come in.
| part | question | tool |
|---|---|---|
| 1 | Can we rebuild the frozen eve exactly? | E94's own model code and seed |
| 2 | What does one call say? | a call as an interval; importance weights and their ESS; a refit with a Potential |
| 3 | How has the night moved the forecast? | the call log replayed snapshot by snapshot; each call's own effect |
| 4 | What did the latest calls change? | the previous snapshot against the latest, race by race and on a map; the closest new call reversed |
| 5 | What is still out, and what does each race decide? | conditional control probabilities |
| 6 | Silences and partial counts | "too close to call" as an interval; margins, and the order ballots are counted |
| 7 | Where the night stands | a bulletin computed from the latest snapshot |
import contextlib
import gzip
import hashlib
import io
import json
import logging
import os
import sys
import time
import warnings

for name in ("OPENBLAS_NUM_THREADS", "OMP_NUM_THREADS", "MKL_NUM_THREADS"):
    os.environ.setdefault(name, "1")  # before NumPy: one BLAS thread per chain
os.environ.setdefault("JAX_PLATFORMS", "cpu")  # nothing here uses a GPU

import arviz as az
import matplotlib.pyplot as plt
import numpy as np
import pandas as pd
import pymc as pm
import pytensor.tensor as pt
from IPython.display import Markdown, display
from matplotlib.collections import LineCollection, PolyCollection
from matplotlib.patches import Circle, Wedge
from scipy.stats import gaussian_kde, norm

from pymc_challenges import data

sys.modules.pop("jax", None)   # ArviZ's lazy JAX stub would import all of JAX for nothing (see E89 and E94)

RANDOM_SEED = 95
rng = np.random.default_rng(RANDOM_SEED)
az.style.use("arviz-variat")
logging.getLogger("pymc").setLevel(logging.WARNING)
warnings.filterwarnings("ignore", category=RuntimeWarning)
warnings.filterwarnings("ignore", category=FutureWarning)
warnings.filterwarnings("ignore", category=UserWarning, message=".*tight.*")
warnings.filterwarnings("ignore", message=".*sample_stats.*")
pd.set_option("display.width", 160)
pd.set_option("display.max_columns", 20)
T_START = time.time()
D_C, R_C, INK, MUTED, LIGHT, GOLD = "#2166ac", "#c0392b", "#222222", "#8a8a8a", "#d9d9d9", "#e08e0b"
TIMES = {}
1 · The eve, rebuilt
The update needs the frozen posterior itself, not just its summaries: every draw of the national
margin, the polling error, the state effects and each race's mean. E94 froze only summaries, so we
rebuild the posterior with E94's own code. The cell below runs E94's sections 1 to 3.2 (the data, the
midterm prior and the model functions) from its source file, quietly, and then calls E94's
fit_cycle(2026) with E94's seed. The data files are the ones whose hashes the frozen file records, so
this is the same posterior, sampled the same way.
E94_SRC = data.DATA_DIR.parent / "notebook_src/examples/E94_midterms_polls_money.py"


def load_e94():
    """Run E94's sections 1 to 3.2 (data, prior, model code), quietly, and return its namespace."""
    src = E94_SRC.read_text()
    cut = src.index("# ### 3.3 Failure 1")
    ns = {"__name__": "e94"}
    with contextlib.redirect_stdout(io.StringIO()):
        exec(compile(src[: src.rindex("# %%", 0, cut)], str(E94_SRC), "exec"), ns)
    plt.close("all")
    return ns


E94 = load_e94()
prepare, build_model, simulate, seats, fit_cycle = (E94[k] for k in ("prepare", "build_model", "simulate", "seats",
                                                                     "fit_cycle"))
t0 = time.time()
eve = fit_cycle(2026, keep=True)           # E94's own call, with E94's seed: the same draws as its section 7
TIMES["eve fit"] = time.time() - t0
d = eve["d"]
tm, tgt = d["tm"], d["tgt"]
FROZEN = json.load(open(data.path("e94_freeze_2026_v2")))
fz = pd.DataFrame(FROZEN["races"]).set_index("race")
for fname, h in FROZEN["inputs_sha256_content"].items():
    b = (data.DATA_DIR / fname).read_bytes()
    same = hashlib.sha256(gzip.decompress(b) if fname.endswith(".gz") else b).hexdigest() == h
    print(f"input {fname:20s} {'as frozen' if same else 'CHANGED since the freeze'}")
notup = {k: int(v) for k, v in E94["build_log"]["senate_2026_not_up"].items()}
NOT_UP = notup["Democratic"] + notup["Independent"]
s_ = eve["seats"]
gap = np.abs((eve["sim"] > 0).mean(0) - fz.loc[tm.race, "pD"].to_numpy())
print({k: eve[k] for k in ("divergences", "max r_hat", "min ESS")})
print(f"P(D) against the frozen v2 file: mean difference {gap.mean():.3f}, largest {gap.max():.2f}")
print(f"House D seats {np.median(s_['H']):.0f}, P(majority) {(s_['H'] >= 218).mean():.2f} (frozen "
      f"{FROZEN['seats']['H']['P_D_control']:.2f}); Senate D caucus {np.median(s_['S'] + NOT_UP):.0f}, "
      f"P(control) {(s_['S'] + NOT_UP >= 51).mean():.2f} (frozen {FROZEN['seats']['S']['P_D_control']:.2f})")
input e94_races.csv        as frozen
input e94_polls.csv        as frozen
input e94_reports.csv.gz   as frozen
input e94_ie.csv.gz        as frozen
input e94_pollerr.csv      as frozen
{'divergences': 0, 'max r_hat': 1.011, 'min ESS': 347}
P(D) against the frozen v2 file: mean difference 0.002, largest 0.04
House D seats 237, P(majority) 0.94 (frozen 0.94); Senate D caucus 52, P(control) 0.79 (frozen 0.78)
The inputs are unchanged, the sampler is clean, and the rebuilt forecast matches the frozen file: race chances differ by 0.002 on average and at most 0.04 (the frozen file came from a separate run of the same code), and the control probabilities agree to the second decimal.
For the update we need each draw's mean margin in every race, before the race's own noise. In E94's model a race with polls has its margin $m_r$ as a parameter, so the sampler already holds it. A race without polls has margin
$$m_r = \mu_r(\theta) + \sigma_{o(r)}\,\varepsilon_r, \qquad \varepsilon_r \sim \mathrm{Normal}(0, 1),$$
where $\mu_r(\theta)$ collects the national margin, the office intercept, the fundamentals and the
state effect, and $\sigma_{o(r)}$ is the race-level sd of its office. E94's simulate adds the noise
by drawing $\varepsilon_r$; here we keep $\mu_r$ and $\sigma_{o(r)}$ separately for all 4,000 draws, so
that the noise can be integrated out exactly.
def eve_draws(d, idata):
    """Every posterior draw's mean margin and race-level sd for each modelled race (no race noise added).

    For a polled race the sampler already holds its margin (m_pol, noise included), so its sd is 0."""
    tm = d["tm"]
    post = az.extract(idata)
    n = post.sizes["sample"]
    isS = (tm.office == "S").to_numpy().astype(int)
    X = np.broadcast_to(np.c_[tm.leanx, tm.inc, np.nan_to_num(tm.money.to_numpy())], (n, len(tm), 3)).copy()
    st = tm.state.map({s: i for i, s in enumerate(d["states"])}).to_numpy()
    T = lambda v, *dims: post[v].transpose("sample", *dims).values  # noqa: E731
    if len(d["miss"]):
        X[:, d["miss"], 2] = T("money_missing", "missing_race")
    icpt = post["N"].values[:, None] + T("gamma", "office") + post["s_int"].values[:, None] * T("z_int_t", "office")
    mu = (icpt[:, isS] + (T("beta", "office", "x")[:, isS, :] * X).sum(-1)
          + (T("z_st_t", "state") * post["s_state"].values[:, None])[:, st])
    sd = np.broadcast_to(T("sig", "office")[:, isS], mu.shape).copy()
    pol_i = np.array([tm.index[tm.race == r][0] for r in d["polled"]])
    mu[:, pol_i], sd[:, pol_i] = T("m_pol", "polled"), 0.0
    return {"mu": mu, "sd": sd, "N": post["N"].values, "bias": post["bias"].values}


E = eve_draws(d, eve["idata"])
RACE = {r: i for i, r in enumerate(tm.race)}
U = np.random.default_rng(RANDOM_SEED).random(E["mu"].shape)     # common random numbers for every outcome draw
p_eve = norm.cdf(E["mu"] / np.where(E["sd"] > 0, E["sd"], 1e-9)).mean(0)
print(f"{E['mu'].shape[0]} draws x {E['mu'].shape[1]} races ({len(d['polled'])} with polls); P(D) from the means "
      f"against the frozen file: largest difference {np.abs(p_eve - fz.loc[tm.race, 'pD']).max():.3f}")
4000 draws x 451 races (104 with polls); P(D) from the means against the frozen file: largest difference 0.040
2 · What one call says
What does "the AP called Georgia for Ossoff" tell us about the model? It says the true margin is positive. We soften the edge a little, because the AP is occasionally wrong and because a margin of exactly zero is not special: the likelihood of a call for the Democrat is
$$P(\text{call D} \mid \theta) = P(m_r > 0 \mid \theta) = \Phi\!\left(\frac{\mu_r(\theta)}{\sqrt{\sigma_{o(r)}^2 + \tau^2}}\right),$$
with $\tau = 0.5$ points. For a race without polls the race noise is integrated out, which is why $\sigma_{o(r)}$ appears; for a race with polls $m_r$ is a parameter and only $\tau$ remains. A call for the Republican uses $\Phi(-\mu_r/\cdot)$, and section 6 adds "too close to call" as an interval around zero.
Importance reweighting. The frozen posterior $p(\theta \mid \text{polls})$ becomes $p(\theta \mid \text{polls}, \text{calls}) \propto p(\theta \mid \text{polls})\, P(\text{calls} \mid \theta)$, so the frozen draws stay valid if each is weighted by $w_s \propto \prod_r P(\text{call}_r \mid \theta_s)$. This is exact for the same reason as E94's prior reweighting: only a factor of the posterior changes. What can go wrong is the sample, not the algebra. If a few draws carry all the weight, the weighted average rests on those few. The effective sample size $\mathrm{ESS} = 1/\sum_s w_s^2$ (weights summing to one) counts how many equally weighted draws the weighted sample is worth.
Forecasts after a call also need each race's chance given the draw and the call: 1 or 0 for a called race, the truncated normal's share above zero for a race known to be close, and $\Phi(\mu_r/\sigma_{o(r)})$ otherwise. Seat totals come from one simulated election per draw, using the same uniform random numbers in every scenario, so that differences between scenarios are not noise.
The first call of the night, Georgia's Senate race for Ossoff, makes a good first example, together with the call that did not happen.
TAU = 0.5     # points: how far on the wrong side of zero a called race could still be (a soft edge)
CLOSE = 3.0   # points: "too close to call" read as |margin| < CLOSE (an assumption, varied in section 6)
FINAL = 95    # a race counts as counted once this share of the expected vote is in; its margin is then data
SKEW = 30.0   # points: how differently the ballots still out could lean from those counted (any direction)


def tau_m(pct_in):
    """sd of a counted margin around the final one: counting noise plus the skew of the uncounted share."""
    return float(np.hypot(0.5, SKEW * (1 - pct_in / 100)))


def info_from(calls, close=CLOSE):
    """One row per race with information: the interval (lo, hi) its true margin lies in."""
    rows = []
    for r in calls.itertuples():
        if r.status == "called":
            rows.append((r.race, 0.0, np.inf) if r.winner == "D" else (r.race, -np.inf, 0.0))
        elif r.status == "too close":
            rows.append((r.race, -close, close))
    return rows


def margins_from(calls):
    """(race, two-party margin, its sd) for the races counted to at least FINAL percent."""
    ok = calls[(calls.pct_expected_in >= FINAL) & calls.d_pct.notna() & calls.r_pct.notna()]
    return [(r.race, 100 * (r.d_pct - r.r_pct) / (r.d_pct + r.r_pct), tau_m(r.pct_expected_in))
            for r in ok.itertuples()]


def loglik(mu, sd, lo, hi):
    """log P(lo < margin < hi) for margin ~ Normal(mu, sqrt(sd^2 + TAU^2)), per draw."""
    s = np.sqrt(sd**2 + TAU**2)
    if np.isinf(hi):
        return norm.logcdf((mu - lo) / s)
    if np.isinf(lo):
        return norm.logcdf((hi - mu) / s)
    return np.log(np.clip(norm.cdf((hi - mu) / s) - norm.cdf((lo - mu) / s), 1e-300, None))


def weights(E, info):
    lw = np.zeros(E["mu"].shape[0])
    for race, lo, hi in info:
        i = RACE[race]
        lw += loglik(E["mu"][:, i], E["sd"][:, i], lo, hi)
    w = np.exp(lw - lw.max())
    return w / w.sum()


def ess(w):
    return 1.0 / np.sum(w**2)


def outcome_probs(E, info):
    """P(D wins the race | draw, information): 1 or 0 for a called race, truncated for a close one."""
    p = norm.cdf(E["mu"] / np.where(E["sd"] > 0, E["sd"], 1e-9))
    for race, lo, hi in info:
        i = RACE[race]
        s = np.sqrt(E["sd"][:, i] ** 2 + TAU**2)
        a, b = norm.cdf((lo - E["mu"][:, i]) / s), norm.cdf((hi - E["mu"][:, i]) / s)
        z = norm.cdf(-E["mu"][:, i] / s)
        p[:, i] = np.clip((b - np.clip(z, a, b)) / np.clip(b - a, 1e-300, None), 0, 1)
    return p


def summarise(E, info, w=None):
    """Weighted forecast: per-race P(D), one simulated election per draw, and control of each chamber."""
    w = np.full(E["mu"].shape[0], 1 / E["mu"].shape[0]) if w is None else w
    p = outcome_probs(E, info)
    won = U < p
    st = seats(d, np.where(won, 1.0, -1.0))
    sen = st["S"] + NOT_UP
    return {"w": w, "ess": ess(w), "pD": w @ p, "won": won, "H": st["H"], "S": sen,
            "P(House)": float(w @ (st["H"] >= 218)), "P(Senate)": float(w @ (sen >= 51)),
            "N": E["N"], "bias": E["bias"]}


def reweighted(info):
    return summarise(E, info, weights(E, info))


def wq(x, w, qs=(0.05, 0.5, 0.95)):
    o = np.argsort(x)
    c = np.cumsum(w[o])
    return np.interp(qs, c - w[o] / 2, x[o])


def line(lab, S):
    iv = lambda v, f: "{1:{f}} [{0:{f}}, {2:{f}}]".format(*wq(v, S["w"]), f=f)  # noqa: E731
    return {"": lab, "ESS": round(S["ess"]), "P(D House)": round(S["P(House)"], 3),
            "P(D Senate)": round(S["P(Senate)"], 3), "House seats": iv(S["H"], ".0f"),
            "Senate seats": iv(S["S"], ".0f"), "N": iv(S["N"], "+.1f"), "polling error": iv(S["bias"], "+.1f")}


EVE = summarise(E, [])
S_GA, S_GAR = reweighted([("GA-S", 0.0, np.inf)]), reweighted([("GA-S", -np.inf, 0.0)])
print(pd.DataFrame([line("eve (frozen posterior)", EVE), line("Georgia called for Ossoff", S_GA),
                    line("if Georgia had gone to Collins", S_GAR)]).set_index("").to_string())
sen_rows = tm.index[tm.office == "S"]
dp = pd.DataFrame({"race": tm.race[sen_rows], "eve": EVE["pD"][sen_rows], "GA called D": S_GA["pD"][sen_rows],
                   "GA to R": S_GAR["pD"][sen_rows]})
print(f"largest move in another Senate race's P(D) from the Ossoff call: "
      f"{(dp['GA called D'] - dp.eve)[dp.race != 'GA-S'].abs().max():.4f}")
                                 ESS  P(D House)  P(D Senate)     House seats Senate seats                   N       polling error

eve (frozen posterior)          4000       0.946        0.801  237 [217, 262]  52 [48, 56]  +8.0 [+3.2, +12.8]   +1.0 [-3.7, +5.9]
Georgia called for Ossoff       3987       0.948        0.804  237 [217, 262]  52 [49, 56]  +8.0 [+3.2, +12.8]   +1.0 [-3.7, +5.8]
if Georgia had gone to Collins    16       0.422        0.139  215 [201, 243]  47 [44, 52]  +2.2 [-0.9, +10.1]  +7.3 [-0.5, +11.0]
largest move in another Senate race's P(D) from the Ossoff call: 0.0016
The frozen forecast gave Ossoff a 0.994 chance (median D+14), so his win was almost no news: the chance of a Democratic House goes from 0.946 to 0.948, of a Democratic Senate from 0.801 to 0.804, and no other Senate race moves by more than 0.002. The weights barely vary (ESS 3,987 of 4,000), because only the 26 draws in which Ossoff loses are down-weighted.
The last row asks the opposite question. A Collins win had a 0.0065 chance, and it would have said a great deal: the polling error would jump from +1.0 to about +7 points (the polls far too Democratic), and both chambers would tilt Republican. But its ESS is 16, so the whole answer rests on the handful of draws in which Ossoff lost, and the numbers in that row are rough. That is the warning light working. A surprising result is exactly the one reweighting cannot handle, and the refit below can.
fig, axes = plt.subplots(1, 3, figsize=(13, 3.6))
ax = axes[0]
g_i = RACE["GA-S"]
ax.hist(E["mu"][:, g_i], bins=60, color=LIGHT, density=True)
ax.set_xlabel("GA Senate margin, eve draws")
ax.set_yticks([])
ax2 = ax.twinx()
gm = np.linspace(E["mu"][:, g_i].min(), E["mu"][:, g_i].max(), 300)
ax2.plot(gm, norm.cdf(gm / TAU), color=D_C, label="Ossoff called")
ax2.plot(gm, norm.cdf(-gm / TAU), color=R_C, label="Collins called")
ax2.set_ylabel("likelihood of the call")
ax2.legend(fontsize=8, loc="upper left")
ax.set_title(f"the call keeps all but the left tail\n(ESS: {S_GA['ess']:.0f} if D, {S_GAR['ess']:.0f} if R)",
             fontsize=10)
ax = axes[1]
gx = np.linspace(-15, 15, 200)
for lab, S, c, ls in (("eve", EVE, INK, ":"), ("Ossoff wins", S_GA, D_C, "-"), ("Collins wins", S_GAR, R_C, "-")):
    ax.plot(gx, gaussian_kde(S["bias"], weights=S["w"])(gx), color=c, ls=ls, label=lab)
ax.set_xlabel("polling error (+ = polls too D)")
ax.set_yticks([])
ax.legend(fontsize=8)
ax.set_title("what the call says about the polls", fontsize=10)
ax = axes[2]
o = np.argsort(dp.eve.to_numpy())
ax.scatter(dp.eve.to_numpy()[o], np.arange(len(o)), color=INK, s=14, label="eve")
ax.scatter(dp["GA called D"].to_numpy()[o], np.arange(len(o)), color=D_C, s=40, marker="|", label="Ossoff wins")
ax.scatter(dp["GA to R"].to_numpy()[o], np.arange(len(o)), color=R_C, s=14, marker="x", label="Collins wins")
ax.set_yticks(range(len(o)), dp.race.to_numpy()[o], fontsize=6)
ax.set_xlabel("P(D) in each Senate race")
ax.legend(fontsize=8, loc="lower right")
ax.set_title("the other Senate races (reweighted)", fontsize=10)
fig.tight_layout();
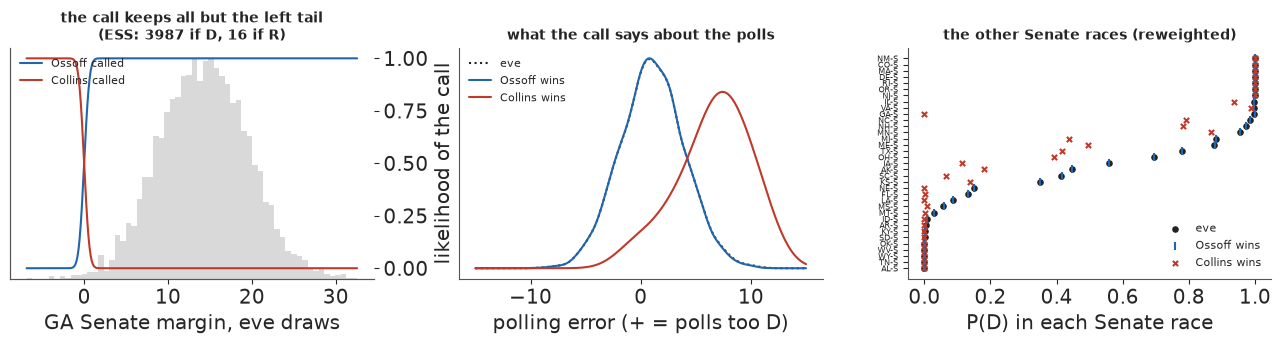
On the left, the eve draws of Georgia's margin (grey) sit almost entirely right of zero, where the likelihood of an Ossoff call (blue) is 1, so the call removes only a sliver of the left tail; a Collins call (red) would have kept only that sliver. In the middle, the Ossoff curve lies on the eve's. On the right, the red crosses show how far a Georgia upset would have dragged every competitive race, through the shared polling error and the national margin. A call moves the rest of the map in proportion to its surprise, and the surprise of a result, $-\log P(\text{result})$ under the forecast, is the measure we carry through the night.
2.1 The same update by NUTS
The refit adds the night's results to E94's model as one pm.Potential, the sum of the log
likelihoods of all calls. For a race with polls the Potential is a function of the parameter $m_r$; for
a race without polls it is a function of $\mu_r(\theta)$, built from the model's own variables, with
the race noise integrated out as above. pm.logcdf of a standard normal keeps the tails stable, and
pm.math.logdiffexp gives the log probability of an interval. A race counted to 95% or more also gets
its margin as data (section 6).
def night_fit(d, info=(), margins=(), seed=RANDOM_SEED):
    """Refit E94's 2026 model with the night's results as extra likelihood terms.

    info: (race, lo, hi) intervals on the true margin; margins: (race, observed two-party margin, its sd)."""
    m = build_model(d)
    tm = d["tm"]
    isS = (tm.office == "S").to_numpy().astype(int)
    st = tm.state.map({s: i for i, s in enumerate(d["states"])}).to_numpy()
    miss = list(d["miss"])
    std = pm.Normal.dist(0, 1)
    with m:
        def mean_sd(race):
            i = RACE[race]
            if race in d["polled"]:
                return m["m_pol"][d["polled"].index(race)], 0.0
            o = isS[i]
            money = m["money_missing"][miss.index(i)] if i in miss else pt.as_tensor(float(tm.money.iloc[i]))
            x = pt.stack([pt.as_tensor(float(tm.leanx.iloc[i])), pt.as_tensor(float(tm.inc.iloc[i])), money])
            mu = (m["N"] + m["gamma"][o] + m["s_int"] * m["z_int_t"][o] + (m["beta"][o] * x).sum()
                  + m["s_state"] * m["z_st_t"][st[i]])
            return mu, m["sig"][o]

        terms = []
        for race, lo, hi in info:
            mu, sd = mean_sd(race)
            s = pt.sqrt(sd**2 + TAU**2)
            if np.isinf(hi):
                terms.append(pm.logcdf(std, (mu - lo) / s))
            elif np.isinf(lo):
                terms.append(pm.logcdf(std, (hi - mu) / s))
            else:
                terms.append(pm.math.logdiffexp(pm.logcdf(std, (hi - mu) / s), pm.logcdf(std, (lo - mu) / s)))
        for race, y, m_sd in margins:
            mu, sd = mean_sd(race)
            terms.append(pm.logp(pm.Normal.dist(mu, pt.sqrt(sd**2 + m_sd**2)), y))
        pm.Potential("night", pt.sum(pt.stack(terms)))
        idata = pm.sample(random_seed=seed, progressbar=False, target_accept=0.9)
    return idata


def refit(info, margins=()):
    idt = night_fit(d, info, margins)
    S = summarise(eve_draws(d, idt), info)
    S["diag"] = E94["diagnostics"](idt)
    return S
3 · The night, call by call
The calls come from the outlets' live pages, entered by hand into a log: one row each time a race is called or listed as too close, with the outlet, the time of the snapshot and the source. A race's latest row is its current state, so the log can be replayed: the forecast at any snapshot uses the rows up to that time. Only Senate races and the competitive House races (a frozen chance between 0.05 and 0.95) are entered, because a safe seat called as expected carries no information.
A call is a projection, not a count: the AP declares a winner when its analysts are sure who leads, often with most of the vote uncounted, and their models know which ballots are still out. Partial counts are a different matter, taken up in section 6.
data.describe("e95_calls_2026")
log = data.load("e95_calls_2026")
log["t"] = pd.to_datetime(log.as_of_et)
log = log.sort_values("t", kind="stable").reset_index(drop=True)
SNAPS = sorted(log.t.unique())


def state_at(t):
    """Each race's latest row at time t: the night's information as of that snapshot."""
    return log[log.t <= t].groupby("race", sort=False).tail(1).reset_index(drop=True)


calls = state_at(SNAPS[-1]).join(fz[["pD", "pred", "q10", "q90"]], on="race")
calls["P(result)"] = np.where(calls.winner == "D", calls.pD, 1 - calls.pD)
calls["surprise"] = (-np.log(np.clip(calls["P(result)"], 1e-4, 1))).where(calls.status == "called")
AS_OF = SNAPS[-1].strftime("%Y-%m-%d %H:%M")
INFO, MARG = info_from(calls), margins_from(calls)
closes = calls[calls.status == "too close"].race.tolist()
print(f"{len(log)} rows in the log, {len(SNAPS)} snapshots; latest {AS_OF} ET: "
      f"{int((calls.status == 'called').sum())} races called, {len(closes)} too close to call")
print(calls[["race", "status", "winner", "reported_by", "as_of_et", "pD", "pred", "surprise"]]
      .sort_values("surprise", ascending=False).round(3).to_string(index=False))
e95_calls_2026: A log: one row each time a race is called or listed as too close; a race's latest row is its state. race (as in e94_races), status (called or too close), winner (D or R), reported_by, as_of_et (the snapshot), the partial count where one was given (d_pct, r_pct, pct_expected_in), source_url.
  source: Election-night race calls (projections by the AP and the networks, not certified results) for the 2026 US midterms, entered by hand from the outlets' live pages named in each row; a snapshot that grows through the night.
  url:    https://abcnews.com/Politics/live-updates/midterm-elections-live-updates/?id=137782085
73 rows in the log, 17 snapshots; latest 2026-11-04 17:22 ET: 69 races called, 1 too close to call
 race    status winner                         reported_by         as_of_et    pD    pred  surprise
IN-05    called      D                                  AP 2026-11-04 02:21 0.180  -5.239     1.715
OH-15    called      D                                  AP 2026-11-03 23:45 0.200  -5.674     1.612
TX-23    called      D                                  AP 2026-11-04 02:21 0.260  -3.646     1.345
 KS-S    called      D                                  AP 2026-11-03 23:45 0.330  -3.263     1.110
VA-01    called      D                                 NBC 2026-11-04 02:21 0.354  -1.856     1.040
 SC-S    called      D                                  AP 2026-11-03 23:18 0.388  -1.607     0.948
MI-04    called      D                                 NBC 2026-11-04 13:21 0.398  -1.410     0.921
IA-01    called      D                                  AP 2026-11-04 01:21 0.428  -1.252     0.850
MO-02    called      D                                  AP 2026-11-04 01:21 0.434  -0.970     0.834
WI-01    called      D                                  AP 2026-11-04 01:21 0.451  -0.645     0.796
OH-07    called      D                                 NBC 2026-11-04 02:21 0.488  -0.194     0.717
FL-22    called      D                                  AP 2026-11-03 23:18 0.498  -0.034     0.697
AL-02    called      D                                CNBC 2026-11-03 23:45 0.504   0.062     0.685
MI-10    called      D                                 NBC 2026-11-04 12:21 0.518   0.249     0.658
KY-06    called      D                                  AP 2026-11-03 23:18 0.558   0.916     0.583
PA-08    called      D                                  AP 2026-11-03 23:18 0.559   0.885     0.582
TX-15    called      D                            CBS News 2026-11-04 16:22 0.560   0.815     0.580
WI-03    called      D                                  AP 2026-11-04 01:21 0.562   1.093     0.576
PA-01    called      D                                  AP 2026-11-04 02:21 0.566   0.978     0.570
 IA-S    called      D                           CNBC, NBC 2026-11-03 23:45 0.566   0.832     0.569
TX-35    called      D                                  AP 2026-11-04 02:21 0.600   1.439     0.512
PA-10    called      D                                 NBC 2026-11-04 02:21 0.603   1.363     0.506
IA-03    called      D                                  AP 2026-11-04 01:21 0.642   2.880     0.443
 OH-S    called      D                                  AP 2026-11-03 23:18 0.654   2.163     0.425
IA-02    called      D                            CBS News 2026-11-04 16:22 0.664   2.343     0.409
CO-08    called      D                                 NBC 2026-11-04 02:21 0.691   2.968     0.370
VA-02    called      D                                  AP 2026-11-04 00:30 0.697   3.066     0.361
NE-01    called      R                            ABC News 2026-11-04 17:22 0.264  -3.508     0.307
MI-07    called      D                                 NBC 2026-11-04 14:21 0.758   4.075     0.276
NC-01    called      D                                 NBC 2026-11-04 02:21 0.761   5.118     0.273
WA-03    called      D                                 NBC 2026-11-04 02:21 0.766   4.265     0.267
 TX-S    called      D                                  AP 2026-11-03 23:18 0.768   5.107     0.263
PA-07    called      D                                  AP 2026-11-03 23:18 0.776   4.280     0.253
FL-25    called      D                                  AP 2026-11-03 20:50 0.792   4.316     0.234
NJ-07    called      D                                  AP 2026-11-03 23:18 0.818   5.305     0.200
OH-09    called      D                                 NBC 2026-11-04 02:21 0.822   4.926     0.197
FL-14    called      D                                  AP 2026-11-03 20:50 0.824   5.367     0.194
CA-22    called      D                                 NBC 2026-11-04 12:21 0.834   7.328     0.182
NC-11    called      D                                  AP 2026-11-03 23:18 0.834   5.103     0.182
 NE-S    called      R                                 NBC 2026-11-04 04:21 0.144  -5.680     0.155
 FL-S    called      R                                 Fox 2026-11-03 20:50 0.138  -5.520     0.148
 ME-S    called      D                                 NBC 2026-11-04 01:21 0.869   5.941     0.140
 MI-S    called      D                             AP, NBC 2026-11-04 03:21 0.880   6.221     0.127
NM-02    called      D                                  AP 2026-11-04 01:21 0.916   7.680     0.088
 LA-S    called      R          AP (Louisiana Illuminator) 2026-11-04 08:49 0.077  -8.175     0.080
TX-34    called      D                                 NBC 2026-11-04 02:21 0.936   8.578     0.067
 MN-S    called      D                                 CBS 2026-11-04 00:18 0.952   8.581     0.049
 NH-S    called      D                            NBC, Fox 2026-11-03 20:20 0.974  10.292     0.026
 MT-S    called      R                                 NBC 2026-11-04 08:49 0.026 -14.145     0.026
 NC-S    called      D                                  AP 2026-11-03 20:50 0.982  11.179     0.018
 ID-S    called      R         Decision Desk HQ (The Hill) 2026-11-04 08:49 0.007 -13.614     0.007
 GA-S    called      D AP, ABC, CBS, NBC, Decision Desk HQ 2026-11-03 20:20 0.994  14.101     0.007
 AR-S    called      R                  AP (ABC10 tracker) 2026-11-04 00:18 0.004 -14.724     0.005
 SD-S    called      R                                  AP 2026-11-04 08:49 0.004 -14.595     0.004
 KY-S    called      R                                  AP 2026-11-03 23:18 0.003 -16.347     0.003
 VA-S    called      D                                 CBS 2026-11-03 20:20 0.998  20.701     0.002
 IL-S    called      D                                 CBS 2026-11-03 23:18 0.998  15.521     0.002
 RI-S    called      D                                 Fox 2026-11-03 20:20 1.000  29.366    -0.000
 MA-S    called      D                             Fox, AP 2026-11-03 20:20 1.000  35.767    -0.000
 AL-S    called      R                                 CBS 2026-11-04 00:18 0.000 -21.762    -0.000
 NJ-S    called      D                                 CBS 2026-11-03 23:18 1.000  28.402    -0.000
 WY-S    called      R                                  AP 2026-11-03 21:28 0.000 -36.926    -0.000
 TN-S    called      R                                 CBS 2026-11-04 00:18 0.000 -25.502    -0.000
 WV-S    called      R                                 CBS 2026-11-03 23:18 0.000 -36.345    -0.000
 OK-S    called      R                                 CBS 2026-11-03 23:18 0.000 -29.023    -0.000
 CO-S    called      D                                 CBS 2026-11-03 23:18 1.000  23.052    -0.000
 NM-S    called      D                                 CBS 2026-11-03 23:18 1.000  20.698    -0.000
 DE-S    called      D                                 CBS 2026-11-03 23:18 1.000  30.662    -0.000
 OR-S    called      D         Decision Desk HQ (The Hill) 2026-11-04 08:49 1.000  30.366    -0.000
 MS-S too close    NaN                                 NBC 2026-11-04 02:21 0.056 -12.121       NaN
The table is sorted by surprise. The races at the bottom were called as expected and carry almost no information; the ones at the top are where the night has said something the forecast did not already know. Upsets, if there are any, are at the top with a surprise above 1 (a result the forecast gave less than a 0.37 chance).
3.1 Replaying the night
The cell replays the log: for each snapshot, the forecast reweighted by every call up to that time, with its ESS. The latest snapshot is also refitted by NUTS, and the two are compared; when they agree, the reweighted path can be trusted, and when the ESS falls below a few hundred, only the refit counts.
path = [{"snapshot": "eve", **{k: v for k, v in line("", EVE).items() if k}}]
S_snap = {}
for t in SNAPS:
    S_snap[t] = reweighted(info_from(state_at(t)))
    path.append({"snapshot": t.strftime("%H:%M"), **{k: v for k, v in line("", S_snap[t]).items() if k}})
path = pd.DataFrame(path)
t0 = time.time()
S_CALLS = refit(INFO)                                 # the latest calls, by NUTS
S0 = refit(INFO, MARG) if MARG else S_CALLS            # the night's forecast: calls, and margins where counted
TIMES["latest refits"] = time.time() - t0
print(path.to_string(index=False))
print("refit at the latest snapshot:", S_CALLS["diag"])
rows = [line(f"{AS_OF[-5:]}: reweighted", S_snap[SNAPS[-1]]), line(f"{AS_OF[-5:]}: NUTS refit", S_CALLS)]
if MARG:
    rows.append(line(f"{AS_OF[-5:]}: refit with counted margins", S0))
    print("counted margins used:", {r: (round(y, 1), round(s, 1)) for r, y, s in MARG})
print(pd.DataFrame(rows).set_index("").to_string())
gap = np.abs(S_snap[SNAPS[-1]]["pD"] - S_CALLS["pD"])
print(f"reweighted against refit, P(D) per race: mean |difference| {gap.mean():.4f}, largest {gap.max():.3f}")
snapshot  ESS  P(D House)  P(D Senate)    House seats Senate seats                    N     polling error
     eve 4000       0.946        0.801 237 [217, 262]  52 [48, 56]   +8.0 [+3.2, +12.8] +1.0 [-3.7, +5.9]
   20:20 1131       0.989        0.926 243 [225, 265]  54 [50, 57]   +9.4 [+5.4, +13.5] -0.3 [-4.4, +3.8]
   20:50 2410       0.986        0.867 239 [222, 261]  53 [49, 56]   +8.4 [+4.3, +12.5] +0.6 [-3.4, +4.6]
   21:28 2410       0.986        0.867 239 [222, 261]  53 [49, 56]   +8.4 [+4.3, +12.5] +0.6 [-3.4, +4.6]
   23:18  302       1.000        1.000 254 [240, 271]  55 [53, 57]  +11.3 [+8.0, +14.5] -2.3 [-5.3, +0.9]
   23:45  114       1.000        1.000 261 [248, 276]  56 [54, 57]  +12.4 [+9.8, +14.9] -3.5 [-5.8, -0.8]
   00:18   72       1.000        1.000 262 [248, 278]  56 [55, 58]  +12.8 [+9.8, +16.2] -3.7 [-6.6, -1.1]
   00:30   66       1.000        1.000 262 [248, 278]  56 [55, 58]  +12.9 [+9.8, +16.2] -3.8 [-6.7, -1.1]
   01:21   30       1.000        1.000 264 [253, 291]  56 [55, 59] +13.7 [+10.1, +16.2] -4.4 [-7.0, -1.4]
   02:21    4       1.000        1.000 278 [266, 291]  57 [55, 57] +14.8 [+12.7, +16.3] -6.3 [-6.7, -3.9]
   03:21    4       1.000        1.000 278 [266, 291]  57 [55, 57] +14.8 [+12.7, +16.3] -6.3 [-6.7, -3.9]
   04:21    6       1.000        1.000 273 [260, 280]  55 [54, 57] +14.0 [+11.7, +15.8] -4.4 [-7.5, -3.3]
   08:49    5       1.000        1.000 266 [260, 274]  55 [54, 55] +12.3 [+11.7, +14.0] -3.9 [-4.8, -3.3]
   12:21    5       1.000        1.000 266 [260, 274]  55 [54, 55] +12.3 [+11.7, +14.0] -3.9 [-4.8, -3.3]
   13:21    3       1.000        1.000 272 [270, 275]  55 [54, 55] +13.8 [+13.7, +14.0] -4.4 [-4.8, -3.8]
   14:21    3       1.000        1.000 272 [270, 274]  55 [54, 55] +13.8 [+13.7, +14.0] -4.4 [-4.8, -3.8]
   16:22    3       1.000        1.000 272 [269, 275]  55 [54, 55] +13.8 [+13.8, +14.0] -4.4 [-4.8, -3.8]
   17:22    2       1.000        1.000 272 [272, 274]  55 [54, 55] +13.8 [+13.8, +14.0] -3.9 [-4.8, -3.8]
refit at the latest snapshot: {'divergences': 0, 'max r_hat': 1.007, 'worst': 's_house', 'min ESS': 339, 'tuning': 400}
counted margins used: {'MS-S': (0.0, 1.0), 'LA-S': (-1.8, 0.6), 'MI-10': (7.3, 0.6)}
                                    ESS  P(D House)  P(D Senate)     House seats Senate seats                     N      polling error

17:22: reweighted                     2         1.0          1.0  272 [272, 274]  55 [54, 55]  +13.8 [+13.8, +14.0]  -3.9 [-4.8, -3.8]
17:22: NUTS refit                  4000         1.0          1.0  270 [259, 282]  55 [54, 56]  +13.6 [+11.3, +16.0]  -4.6 [-6.8, -2.4]
17:22: refit with counted margins  4000         1.0          1.0  271 [260, 284]  55 [54, 56]  +13.9 [+11.7, +16.2]  -4.9 [-7.0, -2.8]
reweighted against refit, P(D) per race: mean |difference| 0.0220, largest 0.707fig, axes = plt.subplots(1, 2, figsize=(13, 3.8))
xs = np.arange(len(path))
lab_x = path.snapshot.tolist()
ok = path.ESS.to_numpy() >= 300
ax = axes[0]
for key, c in (("P(D House)", D_C), ("P(D Senate)", GOLD)):
ax.plot(xs, path[key], color=c, lw=1.5, label=key.replace("P(D ", "").rstrip(")"))
ax.scatter(xs[ok], path[key][ok], color=c, s=30, zorder=3)
ax.scatter(xs[~ok], path[key][~ok], facecolor="white", edgecolor=c, s=30, zorder=3)
ax.scatter([xs[-1]] * 2, [S0["P(House)"], S0["P(Senate)"]], marker="*", s=120, color=INK, zorder=4,
label="latest, NUTS refit")
for k, t in enumerate(SNAPS, start=1):
new = log[log.t == t]
txt = "\n".join(f"{r.race} {'?' if r.status == 'too close' else r.winner}" for r in new.itertuples())
ax.text(k, 0.02, txt, fontsize=6, ha="center", va="bottom", color=MUTED)
ax.set_xticks(xs, lab_x)
ax.set_ylim(0, 1.02)
ax.set_ylabel("P(Democratic control)")
ax.set_xlabel("snapshot (ET); grey: the rows added at each snapshot; hollow: ESS < 300")
ax.legend(fontsize=8, loc="center left")
ax.set_title("control of each chamber through the night", fontsize=10)
ax = axes[1]
qs = np.array([wq(S["bias"], S["w"]) for S in [EVE] + [S_snap[t] for t in SNAPS]])
ax.fill_between(xs, qs[:, 0], qs[:, 2], color=LIGHT)
ax.plot(xs, qs[:, 1], color=INK, marker="o", ms=4)
ax.axhline(0, color=MUTED, lw=0.6, ls=":")
ax.set_xticks(xs, lab_x)
ax.set_ylabel("shared polling error (points)")
ax.set_xlabel("snapshot (ET)")
ax.set_title("what the night says about the polls: median and 90% interval\n(+ = polls too Democratic)",
fontsize=10)
fig.tight_layout();
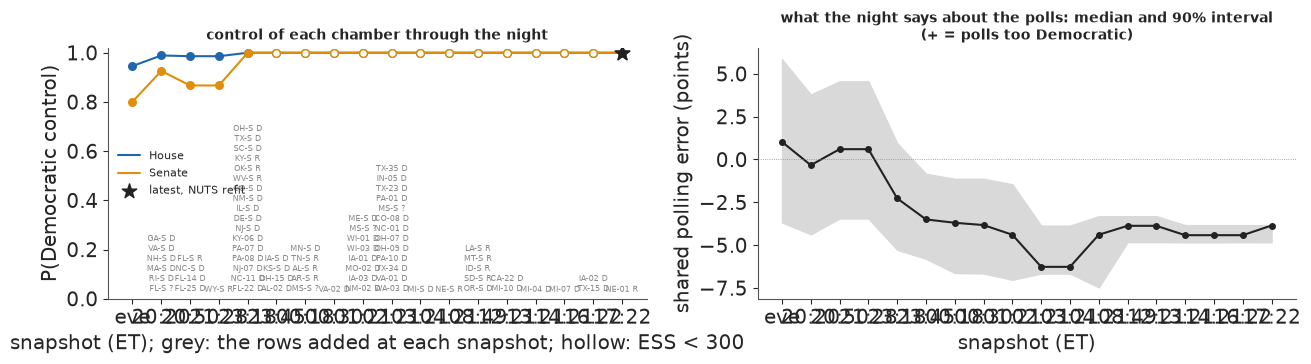
The left panel is the night in one picture: the chance of each chamber after each snapshot, with the races added at that snapshot written underneath. The right panel shows why it moves: each call nudges the shared polling error, and through it every race not yet called. A night of expected calls tightens the interval a little and leaves the median in place; a night that runs ahead of the forecast for one party pushes the median away from the eve's +1. The jumps on the left are rarely from the races that settle a seat directly. They come from the calls that say the polls were off.
3.2 What each call did
How much of the movement is owed to each call? With reweighting this is a quick question: remove one call from the latest snapshot, and see how much the chance of each chamber falls back. This is not an additive decomposition (calls overlap in what they say about the polling error), but it ranks them.
base = S_snap[SNAPS[-1]]
eff = []
for r in calls.itertuples():
    rest = [x for x in INFO if x[0] != r.race]
    S = reweighted(rest)
    eff.append({"race": r.race, "result": "too close" if r.status == "too close" else r.winner,
                "surprise": r.surprise,
                "House": base["P(House)"] - S["P(House)"], "Senate": base["P(Senate)"] - S["P(Senate)"]})
eff = pd.DataFrame(eff)
eff.insert(2, "P(result) on the eve", calls["P(result)"].where(calls.status == "called").to_numpy())
eff = eff.reindex((eff.House.abs() + eff.Senate.abs()).sort_values(ascending=False).index)
print(eff.round(4).to_string(index=False))
fig, ax = plt.subplots(figsize=(8, 0.3 * len(eff) + 1.2))
y_ = np.arange(len(eff))[::-1]
ax.barh(y_ + 0.2, eff.Senate, height=0.4, color=GOLD, label="Senate")
ax.barh(y_ - 0.2, eff.House, height=0.4, color=D_C, label="House")
ax.axvline(0, color=INK, lw=0.6)
ax.set_yticks(y_, [f"{r} ({x})" for r, x in zip(eff.race, eff.result)], fontsize=7)
ax.set_xlabel("change in P(Democratic control) owed to this call (latest snapshot, reweighted)")
ax.legend(fontsize=8)
ax.set_title("what each call did", fontsize=10);
 race    result  P(result) on the eve  surprise  House  Senate
NC-01         D                0.7610    0.2731    0.0     0.0
PA-01         D                0.5655    0.5700    0.0     0.0
MI-04         D                0.3980    0.9213    0.0     0.0
 IA-S         D                0.5660    0.5692    0.0     0.0
 OK-S         R                1.0000   -0.0000    0.0     0.0
 SC-S         D                0.3875    0.9480    0.0     0.0
PA-10         D                0.6030    0.5058    0.0     0.0
IN-05         D                0.1800    1.7148    0.0     0.0
IA-02         D                0.6640    0.4095    0.0     0.0
VA-02         D                0.6970    0.3610    0.0     0.0
 VA-S         D                0.9985    0.0015    0.0     0.0
 MA-S         D                1.0000   -0.0000    0.0     0.0
CA-22         D                0.8340    0.1815   -0.0    -0.0
WA-03         D                0.7655    0.2672    0.0     0.0
 SD-S         R                0.9965    0.0035    0.0     0.0
 ID-S         R                0.9930    0.0070    0.0     0.0
KY-06         D                0.5585    0.5825    0.0     0.0
 DE-S         D                1.0000   -0.0000    0.0     0.0
 KY-S         R                0.9970    0.0030    0.0     0.0
 NJ-S         D                1.0000   -0.0000    0.0     0.0
 TX-S         D                0.7685    0.2633    0.0     0.0
FL-14         D                0.8240    0.1936    0.0     0.0
WI-01         D                0.4510    0.7963    0.0     0.0
PA-08         D                0.5590    0.5816    0.0     0.0
AL-02         D                0.5040    0.6852    0.0     0.0
OH-09         D                0.8215    0.1966    0.0     0.0
 MS-S too close                   NaN       NaN    0.0     0.0
TX-35         D                0.5995    0.5117    0.0     0.0
OH-07         D                0.4880    0.7174    0.0     0.0
CO-08         D                0.6910    0.3696    0.0     0.0
WI-03         D                0.5620    0.5763    0.0     0.0
TX-23         D                0.2605    1.3452    0.0     0.0
FL-22         D                0.4980    0.6972    0.0     0.0
OH-15         D                0.1995    1.6119    0.0     0.0
PA-07         D                0.7765    0.2530    0.0     0.0
NJ-07         D                0.8185    0.2003    0.0     0.0
 WV-S         R                1.0000   -0.0000    0.0     0.0
 WY-S         R                1.0000   -0.0000    0.0     0.0
MI-10         D                0.5180    0.6578    0.0     0.0
MI-07         D                0.7585    0.2764    0.0     0.0
TX-15         D                0.5600    0.5798    0.0     0.0
 OR-S         D                1.0000   -0.0000    0.0     0.0
 LA-S         R                0.9230    0.0801    0.0     0.0
 MT-S         R                0.9740    0.0263    0.0     0.0
 MI-S         D                0.8805    0.1273    0.0     0.0
 NE-S         R                0.8565    0.1549    0.0     0.0
NE-01         R                0.7360    0.3065    0.0     0.0
VA-01         D                0.3535    1.0399    0.0     0.0
IA-03         D                0.6420    0.4432    0.0     0.0
MO-02         D                0.4345    0.8336    0.0     0.0
 FL-S         R                0.8625    0.1479    0.0     0.0
 RI-S         D                1.0000   -0.0000    0.0     0.0
 NH-S         D                0.9740    0.0263    0.0     0.0
 GA-S         D                0.9935    0.0065    0.0     0.0
 ME-S         D                0.8690    0.1404    0.0     0.0
 AR-S         R                0.9955    0.0045    0.0     0.0
 TN-S         R                1.0000   -0.0000    0.0     0.0
 AL-S         R                1.0000   -0.0000    0.0     0.0
 MN-S         D                0.9525    0.0487    0.0     0.0
 KS-S         D                0.3295    1.1102    0.0     0.0
NC-11         D                0.8340    0.1815    0.0     0.0
 IL-S         D                0.9985    0.0015    0.0     0.0
 OH-S         D                0.6540    0.4246    0.0     0.0
 CO-S         D                1.0000   -0.0000    0.0     0.0
 NC-S         D                0.9820    0.0182    0.0     0.0
FL-25         D                0.7915    0.2338    0.0     0.0
 NM-S         D                1.0000   -0.0000    0.0     0.0
TX-34         D                0.9355    0.0667    0.0     0.0
IA-01         D                0.4275    0.8498    0.0     0.0
NM-02         D                0.9155    0.0883    0.0     0.0
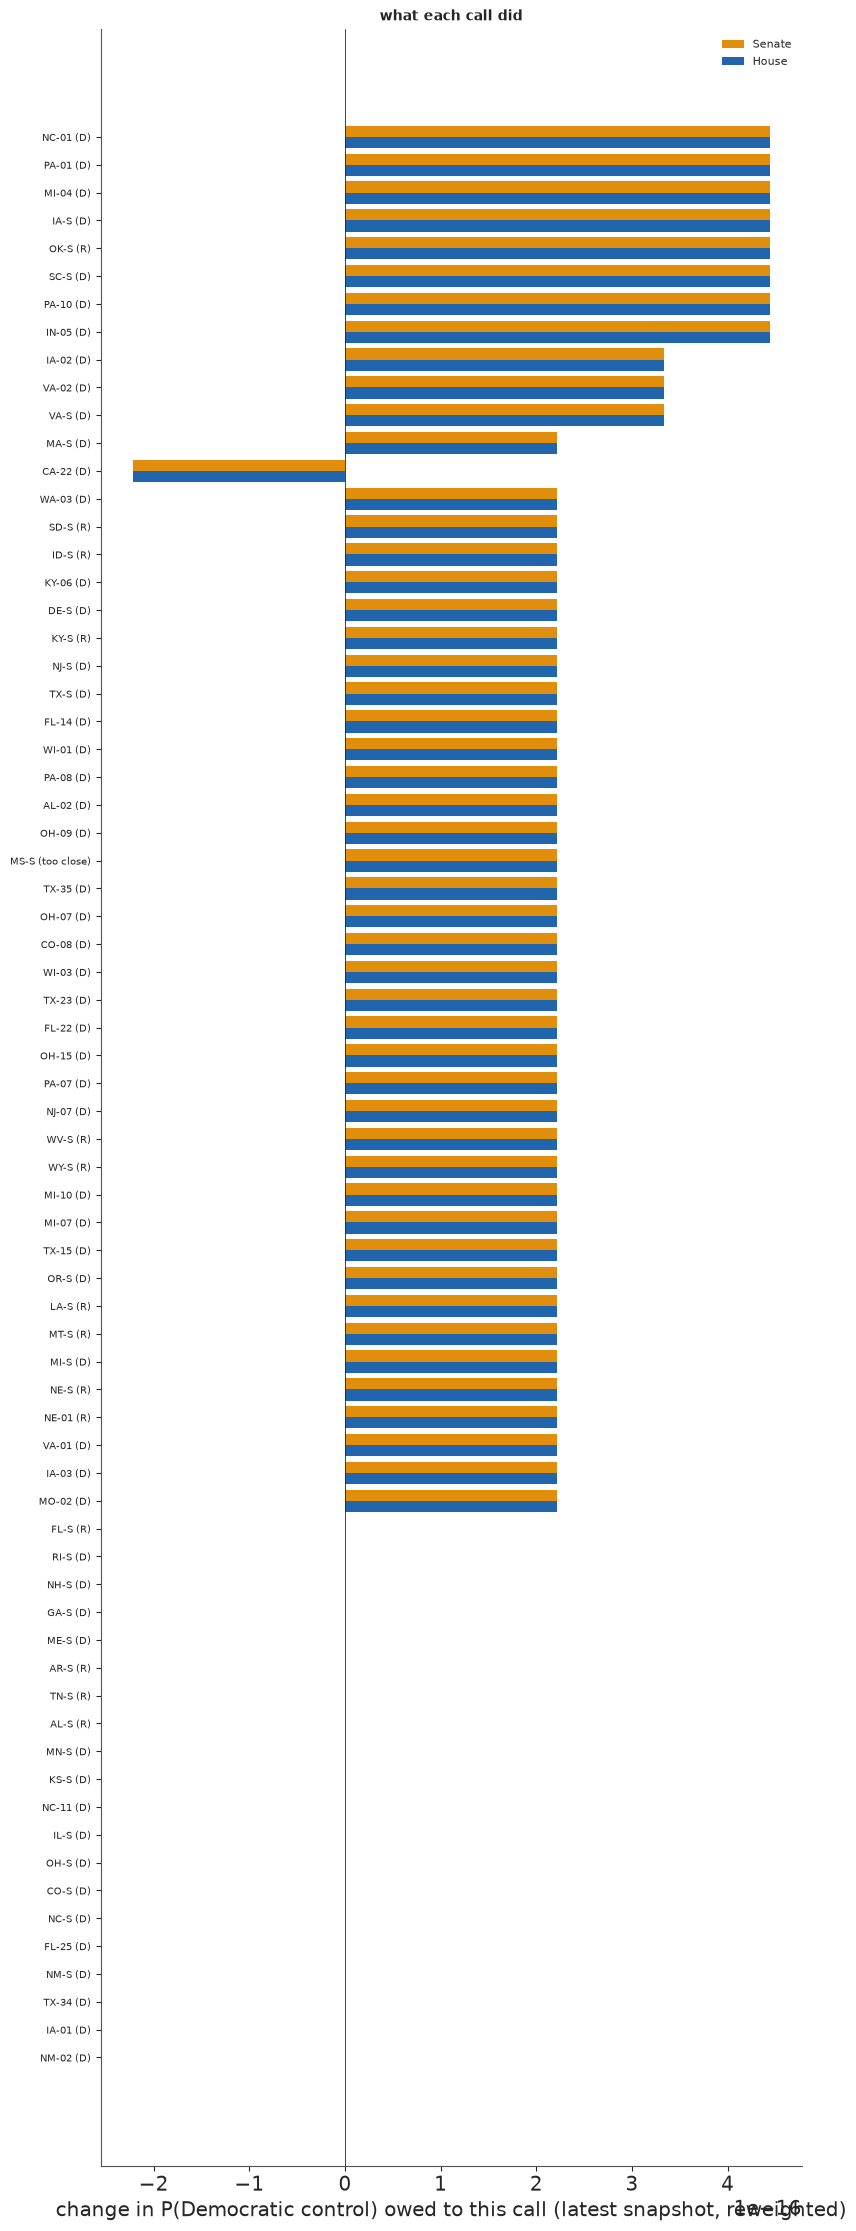
Expected calls sit near zero. The bars that matter belong to results the forecast thought less likely: a Democratic win in a Republican-leaning seat lifts the Democrats' chances everywhere, a Republican win in a seat the Democrats expected to take pulls them down, and a race listed as too close in a state one party was expected to win easily acts like a small upset (section 6).
4 · What the latest calls changed
The bulletin of the night is the difference between the last two snapshots. Two refits would differ by their own sampling noise, a couple of hundredths per race, which is as large as what one batch of calls usually does. So the change is measured on the same 4,000 draws, reweighted for each snapshot: the noise then cancels, and the difference is exactly what the new rows did (the ESS column of the replay says whether the weights can be trusted). Late in the night that trust runs out: once the latest snapshot's reweighting ESS falls below 300, a handful of draws carry all the weight and the reweighted change is mostly noise. From then on the change is measured between two NUTS refits, the previous snapshot's and the latest, and moves of a couple of hundredths should be read as noise. The cell lists the races whose chances moved most and maps the change in every Senate race (and, in section 4.1, every House district). It also asks how much the latest calls mattered: the closest race called in the latest snapshot, or so far if none of the new calls was in doubt, had it gone the other way, by refit.
PREV = SNAPS[-2] if len(SNAPS) > 1 else None
REFIT_ESS = 300
REFITTED = {}                                            # refits by snapshot
t0 = time.time()
if S_snap[SNAPS[-1]]["ess"] >= REFIT_ESS:
    MOVE_HOW = "reweighted"
    S_PREV = S_snap[PREV] if PREV is not None else EVE  # the same draws as the latest snapshot
    S_LAST = S_snap[SNAPS[-1]]
else:
    MOVE_HOW = "refit"
    if PREV is None:
        S_PREV = EVE
    else:
        st_prev = state_at(PREV)
        S_PREV = REFITTED[PREV] = refit(info_from(st_prev), margins_from(st_prev))
    S_LAST = S0
new_rows = log[log.t == SNAPS[-1]]
doubt = calls[(calls.status == "called") & calls.pD.between(0.02, 0.98)]   # a reversal must be possible
new_doubt = doubt[doubt.race.isin(new_rows.race)]
pool, FLIP_WHEN = (new_doubt, "the closest race called at the latest snapshot") if len(new_doubt) else \
    (doubt, "the closest race called so far (none of the latest calls was in doubt)")
flip = pool.assign(gap=(pool.pD - 0.5).abs()).sort_values("gap").race.iloc[0]
flip_win = calls.set_index("race").winner[flip]
INFO_F = [x for x in INFO if x[0] != flip] + [(flip, 0.0, np.inf) if flip_win == "R" else (flip, -np.inf, 0.0)]
S_FLIP = refit(INFO_F, [m_ for m_ in MARG if m_[0] != flip])
TIMES["counterfactual refit"] = time.time() - t0
prev_lab = PREV.strftime("%H:%M") if PREV is not None else "eve"
print(f"{MOVE_HOW} (latest reweighting ESS {S_snap[SNAPS[-1]]['ess']:.0f}), previous snapshot {prev_lab}: P(D House) {S_PREV['P(House)']:.3f}, P(D Senate) "
      f"{S_PREV['P(Senate)']:.3f}; latest {AS_OF[-5:]}: {S_LAST['P(House)']:.3f}, {S_LAST['P(Senate)']:.3f}")
print("rows added at the latest snapshot:", ", ".join(f"{r.race} {r.status} {r.winner if r.status == 'called' else ''}"
                                                    .strip() for r in new_rows.itertuples()))
called_now = set(calls.race[calls.status == "called"])
mv = pd.DataFrame({"race": tm.race, "office": tm.office, "eve": EVE["pD"], "previous": S_PREV["pD"], "latest": S_LAST["pD"]})
mv["change"] = mv.latest - mv.previous
mv = mv[~mv.race.isin(called_now)]
print(f"races not yet called that moved most since the previous snapshot ({prev_lab}):")
print(mv.reindex(mv.change.abs().sort_values(ascending=False).index).head(12).round(3).to_string(index=False))
print(f"\ncounterfactual, {FLIP_WHEN}: {flip} (eve P(D) {fz.pD[flip]:.2f}) to the {'Democrat' if flip_win == 'R' else 'Republican'} "
      f"instead: P(D House) {S_FLIP['P(House)']:.3f}, P(D Senate) {S_FLIP['P(Senate)']:.3f}")
cf = pd.DataFrame({"race": tm.race, "now": S0["pD"], "reversed": S_FLIP["pD"]})
cf["change"] = cf.reversed - cf.now
cf = cf[~cf.race.isin(called_now)]
print(cf.reindex(cf.change.abs().sort_values(ascending=False).index).head(8).round(3).to_string(index=False))
refit (latest reweighting ESS 2), previous snapshot 16:22: P(D House) 1.000, P(D Senate) 1.000; latest 17:22: 1.000, 1.000
rows added at the latest snapshot: NE-01 called R
races not yet called that moved most since the previous snapshot (16:22):
 race office   eve  previous  latest  change
NJ-02      H 0.068     0.343   0.297  -0.046
KS-02      H 0.064     0.380   0.339  -0.041
NY-21      H 0.075     0.426   0.388  -0.038
MN-08      H 0.044     0.276   0.239  -0.037
CO-05      H 0.357     0.844   0.808  -0.036
TX-10      H 0.037     0.275   0.240  -0.035
GA-07      H 0.063     0.353   0.318  -0.035
TX-09      H 0.049     0.331   0.297  -0.034
GA-11      H 0.056     0.314   0.282  -0.032
FL-13      H 0.264     0.731   0.700  -0.031
MN-01      H 0.279     0.774   0.744  -0.031
TN-09      H 0.159     0.552   0.521  -0.030

counterfactual, the closest race called at the latest snapshot: NE-01 (eve P(D) 0.26) to the Democrat instead: P(D House) 1.000, P(D Senate) 1.000
 race   now  reversed  change
NJ-02 0.297     0.358   0.061
MN-08 0.239     0.291   0.053
TN-09 0.521     0.572   0.051
NY-21 0.388     0.439   0.051
AR-02 0.425     0.474   0.049
GA-07 0.318     0.368   0.049
KS-02 0.339     0.387   0.048
TX-09 0.297     0.345   0.047
The first list is what the latest batch of calls did to the races still out. The second is the measure of how much the closest of the new calls mattered: a reversal would have moved the races listed by that much. Both lists are dominated by the same kind of race, the competitive seats in either chamber whose fate hangs on the national environment, because that is what a call mostly speaks to.
FIPS = {"01": "AL", "02": "AK", "04": "AZ", "05": "AR", "06": "CA", "08": "CO", "09": "CT", "10": "DE",
        "11": "DC", "12": "FL", "13": "GA", "15": "HI", "16": "ID", "17": "IL", "18": "IN", "19": "IA",
        "20": "KS", "21": "KY", "22": "LA", "23": "ME", "24": "MD", "25": "MA", "26": "MI", "27": "MN",
        "28": "MS", "29": "MO", "30": "MT", "31": "NE", "32": "NV", "33": "NH", "34": "NJ", "35": "NM",
        "36": "NY", "37": "NC", "38": "ND", "39": "OH", "40": "OK", "41": "OR", "42": "PA", "44": "RI",
        "45": "SC", "46": "SD", "47": "TN", "48": "TX", "49": "UT", "50": "VT", "51": "VA", "53": "WA",
        "54": "WV", "55": "WI", "56": "WY"}


def place(ring, st):
    """Lower 48 as longitude and latitude; Alaska and Hawaii moved and scaled into the corner (as in E94)."""
    x, y = ring[:, 0], ring[:, 1]
    if st == "AK":
        x, y = -118 + (x + 152) * 0.2, 25 + (y - 63) * 0.35
    elif st == "HI":
        x, y = -104 + (x + 157), 25 + (y - 20.5)
    return np.c_[x, y]


rings, ring_state = [], []
for ft in json.load(open(data.path("us_counties_geojson")))["features"]:
    st = FIPS.get(ft["properties"]["STATE"])
    geom = ft["geometry"]
    for poly in ([geom["coordinates"]] if geom["type"] == "Polygon" else geom["coordinates"]):
        ring = np.asarray(poly[0], float)
        if st and not (st == "AK" and ring[:, 0].max() > 0):      # Aleutians past 180 degrees dropped
            rings.append(place(ring, st))
            ring_state.append(st)
ring_state = np.array(ring_state)
seen_ = {}
for ring, st in zip(rings, ring_state):                          # state borders, no GIS dissolve (E89)
    r_ = np.round(ring, 3)
    for a_, b_ in zip(map(tuple, r_[:-1]), map(tuple, r_[1:])):
        seen_.setdefault((a_, b_) if a_ < b_ else (b_, a_), set()).add(st)
borders = [e for e, g_ in seen_.items() if len(g_) > 1]
sen_of = {tm.state[i]: i for i in sen_rows}
ring_race = np.array([sen_of.get(s, -1) for s in ring_state])
centre = {s: np.median(np.vstack([r for r, s_ in zip(rings, ring_state) if s_ == s]), 0) for s in sen_of}

fig, axes = plt.subplots(1, 3, figsize=(16, 4.2))
cmap = plt.get_cmap("RdBu").copy()
cmap.set_bad(LIGHT)
panels = ((axes[0], S0["pD"], plt.Normalize(0, 1), INFO, f"P(D) in each Senate race at {AS_OF[-5:]}", "P(D)"),
          (axes[1], S_LAST["pD"] - S_PREV["pD"], plt.Normalize(-0.15, 0.15), INFO,
           f"change since {prev_lab}", "change in P(D), clipped at 0.15"),
          (axes[2], S_FLIP["pD"] - S0["pD"], plt.Normalize(-0.15, 0.15), INFO_F,
           f"change had {flip} gone the other way", "change in P(D), clipped at 0.15"))
for ax, v, nrm, inf_, title, lab in panels:
    vals = np.ma.masked_array(np.where(ring_race >= 0, v[np.maximum(ring_race, 0)], 0.0), ring_race < 0)
    ax.add_collection(PolyCollection(rings, array=vals, cmap=cmap, norm=nrm, edgecolor="face", linewidth=0.4))
    ax.add_collection(LineCollection(borders, color="white", lw=0.5))
    for race, lo, hi in inf_:
        if race.endswith("-S"):
            mark = "D" if np.isinf(hi) else ("R" if np.isinf(lo) else "?")
            ax.text(*centre[tm.state[RACE[race]]], mark, ha="center", va="center", fontsize=7, weight="bold",
                    color=INK)
    ax.set_xlim(-125, -66)
    ax.set_ylim(17, 50)
    ax.set_aspect(1 / np.cos(np.radians(38)))
    ax.set_axis_off()
    ax.set_title(title, fontsize=10)
    fig.colorbar(plt.cm.ScalarMappable(nrm, cmap), ax=ax, orientation="horizontal", fraction=0.05, pad=0.02, label=lab)
fig.suptitle("Senate races: letters mark called races (D, R) and races too close to call (?)", fontsize=10);
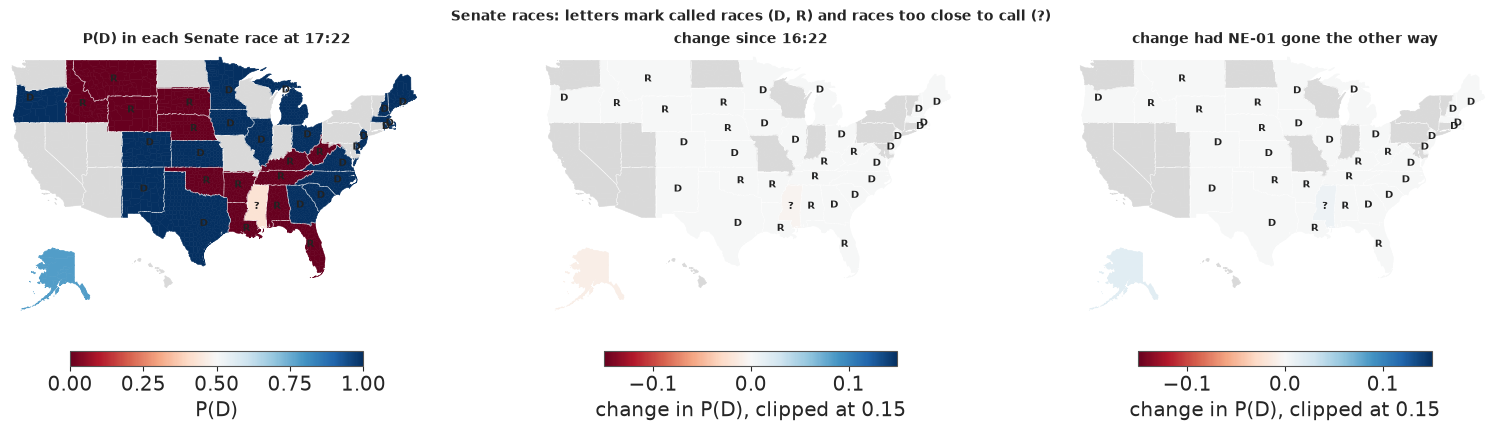
The left map is the state of the Senate race by race; called states carry their letter. The middle map is the latest batch's effect on the races still open: a call that runs ahead of the forecast for one party tints the whole map that party's colour, most strongly in the states whose races were close. The right map is the same picture for the counterfactual. These maps show only the Senate. The counties are drawn only to build the states.
4.1 The House, district by district
The House gets the same treatment with its own geography: the 435 districts as the Census Bureau drew them for the 120th Congress. These are the lines on tonight's ballots, including the maps that Texas, California and others redrew in the middle of the decade. Each district is shaded by its latest P(D), and called districts are outlined in black. A map of districts misleads in one known way. The districts hold the same number of people, not the same area, so the big rural districts look important and the cities, where most of the close suburban seats sit, shrink to specks. The insets enlarge four of those metro areas. The 19 districts that only one party is contesting are not in the model; they are shaded as certain for that party.
cd = np.load(data.path("e95_cd120_districts"))
d_rings = [place(cd["xy"][a:b].astype(float), c[:2]) for a, b, c in zip(cd["start"][:-1], cd["start"][1:], cd["code"])]
d_idx = np.array([RACE.get(c, -1) for c in cd["code"]])
r26 = pd.read_csv(data.path("e94_races")).query("cycle == 2026 and office == 'H'").set_index("race")
d_fixed = np.array([float(r26.d_name.notna()[c]) for c in cd["code"]])   # uncontested: not modelled, certain


def by_district(v, fixed):
    return np.where(d_idx >= 0, np.asarray(v)[np.maximum(d_idx, 0)], fixed)


called_h = {race for race, lo, hi in INFO if not race.endswith("-S") and (np.isinf(lo) or np.isinf(hi))}
d_called = np.array([c in called_h for c in cd["code"]])
INSETS = (("New York", (-74.6, -73.0, 40.3, 41.3)), ("Philadelphia", (-76.2, -74.6, 39.6, 40.6)),
          ("Los Angeles", (-118.9, -117.3, 33.5, 34.5)), ("Miami", (-80.9, -79.9, 25.4, 26.6)))

fig = plt.figure(figsize=(15, 8.6))
gs = fig.add_gridspec(2, 4, height_ratios=[3.2, 1], hspace=0.05, wspace=0.08)
panels = ((fig.add_subplot(gs[0, :2]), S0["pD"], plt.Normalize(0, 1), f"P(D) in each House district at {AS_OF[-5:]}",
           "P(D)"),
          (fig.add_subplot(gs[0, 2:]), S_LAST["pD"] - S_PREV["pD"], plt.Normalize(-0.3, 0.3),
           f"change since {prev_lab}", "change in P(D), clipped at 0.3"))
for k, (ax, v, nrm, title, lab) in enumerate(panels):
    ax.add_collection(PolyCollection(d_rings, array=(by_district(v, d_fixed) if k == 0 else
                                            np.ma.masked_array(by_district(v, 0.0), d_called | (d_idx < 0))), cmap=cmap, norm=nrm, edgecolor="white", linewidth=0.15))
    ax.add_collection(PolyCollection([r for r, c_ in zip(d_rings, d_called) if c_], facecolor="none",
                                     edgecolor=INK, linewidth=0.6))
    ax.add_collection(LineCollection(borders, color="white", lw=0.6))
    ax.set_xlim(-125, -66)
    ax.set_ylim(17, 50)
    ax.set_aspect(1 / np.cos(np.radians(38)))
    ax.set_axis_off()
    ax.set_title(title, fontsize=10)
    fig.colorbar(plt.cm.ScalarMappable(nrm, cmap), ax=ax, orientation="horizontal", fraction=0.03, pad=0.0,
                 shrink=0.5, label=lab)
    if k == 0:
        for name, (x0, x1, y0, y1) in INSETS:
            ax.add_patch(plt.Rectangle((x0, y0), x1 - x0, y1 - y0, fill=False, ec=INK, lw=0.6))
for j, (name, (x0, x1, y0, y1)) in enumerate(INSETS):
    ax = fig.add_subplot(gs[1, j])
    ax.add_collection(PolyCollection(d_rings, array=by_district(S0["pD"], d_fixed), cmap=cmap, norm=plt.Normalize(0, 1),
                                     edgecolor="white", linewidth=0.3))
    ax.add_collection(PolyCollection([r for r, c_ in zip(d_rings, d_called) if c_], facecolor="none",
                                     edgecolor=INK, linewidth=0.9))
    ax.set_xlim(x0, x1)
    ax.set_ylim(y0, y1)
    ax.set_aspect(1 / np.cos(np.radians((y0 + y1) / 2)))
    ax.set_xticks([])
    ax.set_yticks([])
    ax.set_title(f"{name}: P(D)", fontsize=9)
fig.suptitle(f"House districts: {len(called_h)} tracked districts called (outlined in black)",
             fontsize=10);
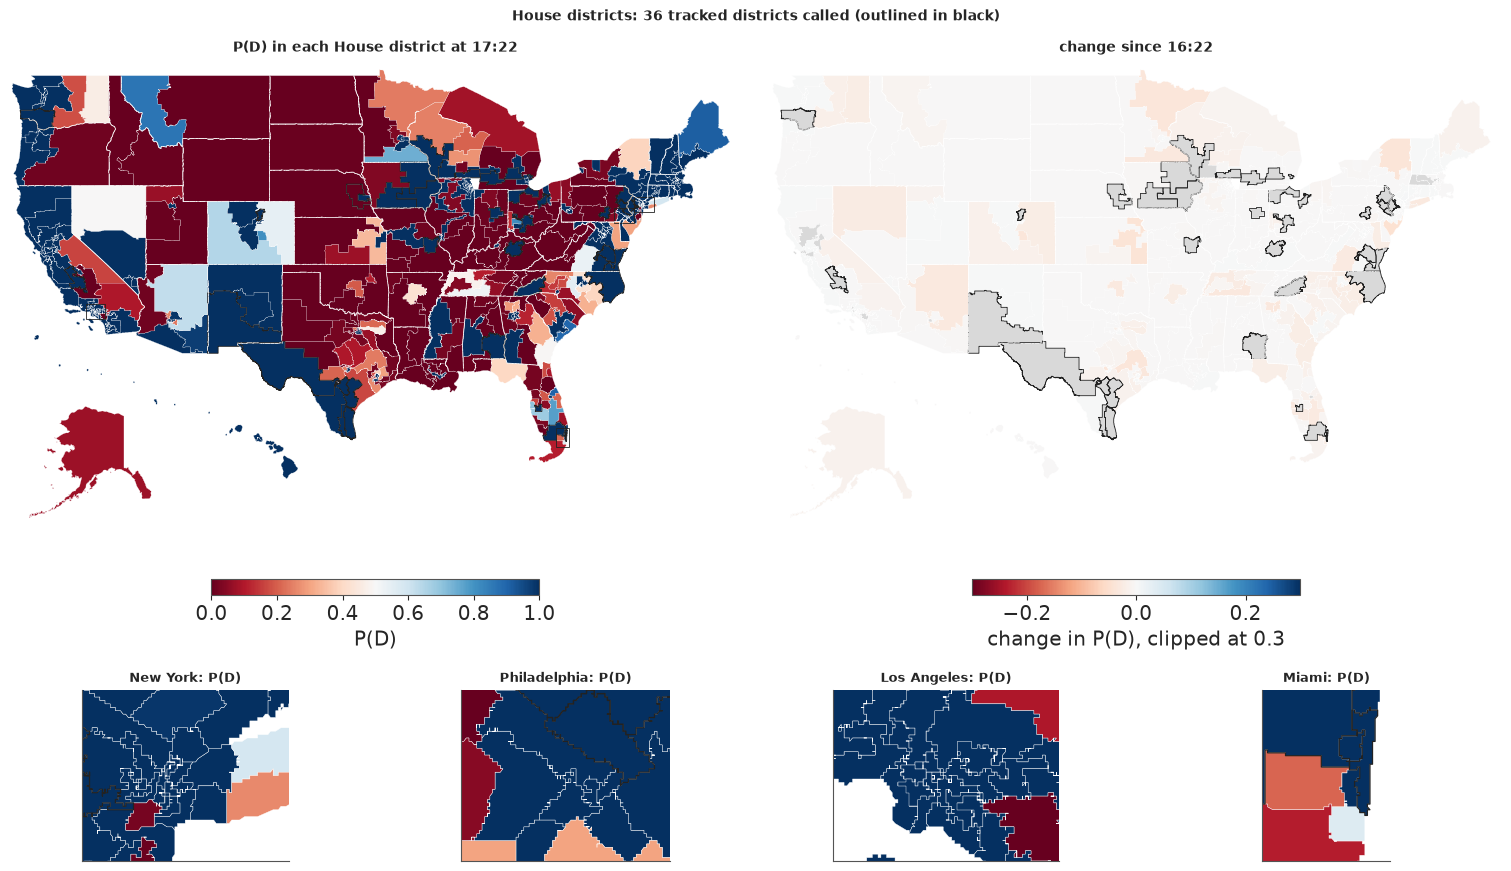
Read the left map for where the House stands, and the right one for what the latest batch of calls did to the districts not yet called (called and uncontested districts are grey there). Because each call is read partly as news about the shared polling error, a batch that runs ahead of the forecast for one party tints every open district toward that party, not only the neighbours of the called seats. The outlines show how few of the called House races the log holds: only the competitive ones are logged, and safe seats carry no information.
5 · What is still out
For every race still in doubt we can ask the question a viewer asks next: if the Democrat wins this one, what happens to control, and if the Republican does? With one simulated election per draw these are conditional frequencies: among the draws in which the Democrat wins race $r$, the share in which the Democrats control the Senate. The difference between the two answers is how much the race matters. It mixes two things, the seat itself and what winning it says about the polling error, which is why a race can matter even when its seat is not the one that decides control.
called = {r for r, *_ in INFO if r not in closes}
open_ = [i for i in range(len(tm)) if tm.race[i] not in called and 0.05 < S0["pD"][i] < 0.95]


def cond(S, i, need, chamber):
    dwin = S["won"][:, i]
    hit = S[chamber] >= need
    return S["w"][dwin] @ hit[dwin] / S["w"][dwin].sum(), S["w"][~dwin] @ hit[~dwin] / S["w"][~dwin].sum()


rows = []
for i in open_:
    hD, hR = cond(S0, i, 218, "H")
    sD, sR = cond(S0, i, 51, "S")
    rows.append({"race": tm.race[i], "office": tm.office[i], "P(D)": S0["pD"][i], "House if D": hD,
                 "House if R": hR, "Senate if D": sD, "Senate if R": sR})
watch = pd.DataFrame(rows)
watch["House swing"] = watch["House if D"] - watch["House if R"]
watch["Senate swing"] = watch["Senate if D"] - watch["Senate if R"]
print(f"{len(watch)} races still uncertain (0.05 < P(D) < 0.95). Senate races:")
print(watch[watch.office == "S"].sort_values("Senate swing", ascending=False).round(3).to_string(index=False))
print("the House races that move House control most:")
print(watch[watch.office == "H"].sort_values("House swing", ascending=False).head(12).round(3).to_string(index=False))
87 races still uncertain (0.05 < P(D) < 0.95). Senate races:
race office  P(D)  House if D  House if R  Senate if D  Senate if R  House swing  Senate swing
AK-S      S 0.779         1.0         1.0          1.0          1.0         -0.0          -0.0
MS-S      S 0.426         1.0         1.0          1.0          1.0         -0.0          -0.0
the House races that move House control most:
 race office  P(D)  House if D  House if R  Senate if D  Senate if R  House swing  Senate swing
FL-13      H 0.700         1.0         1.0          1.0          1.0          0.0           0.0
NY-01      H 0.589         1.0         1.0          1.0          1.0          0.0           0.0
TX-38      H 0.184         1.0         1.0          1.0          1.0          0.0           0.0
FL-26      H 0.208         1.0         1.0          1.0          1.0          0.0           0.0
TX-21      H 0.210         1.0         1.0          1.0          1.0          0.0           0.0
TX-24      H 0.242         1.0         1.0          1.0          1.0          0.0           0.0
NC-10      H 0.149         1.0         1.0          1.0          1.0          0.0           0.0
SC-05      H 0.154         1.0         1.0          1.0          1.0          0.0           0.0
TN-04      H 0.060         1.0         1.0          1.0          1.0          0.0           0.0
FL-05      H 0.092         1.0         1.0          1.0          1.0          0.0           0.0
WI-08      H 0.204         1.0         1.0          1.0          1.0          0.0           0.0
TX-03      H 0.212         1.0         1.0          1.0          1.0          0.0           0.0
ws = watch[watch.office == "S"].sort_values("Senate swing")
wh = watch[watch.office == "H"].sort_values("House swing").tail(15)
fig, axes = plt.subplots(1, 2, figsize=(13, 4.8))
for ax, w_, a, b, lab, base_ in ((axes[0], ws, "Senate if R", "Senate if D", "P(D Senate control)", S0["P(Senate)"]),
                                 (axes[1], wh, "House if R", "House if D", "P(D House majority)", S0["P(House)"])):
    y_ = np.arange(len(w_))
    ax.hlines(y_, w_[a], w_[b], color=LIGHT, lw=3)
    ax.scatter(w_[a], y_, color=R_C, s=25, label="if the Republican wins", zorder=3)
    ax.scatter(w_[b], y_, color=D_C, s=25, label="if the Democrat wins", zorder=3)
    ax.axvline(base_, color=INK, lw=0.8, ls=":")
    ax.set_yticks(y_, [f"{r}  ({p:.2f})" for r, p in zip(w_.race, w_["P(D)"])], fontsize=7)
    ax.set_xlabel(lab + " (dotted: now)")
    lo_ = float(min(w_[a].min(), base_)) if len(w_) else 0.0
    ax.set_xlim(max(0.0, lo_ - 0.1 * (1 - lo_) - 0.01), 1.0)
axes[0].legend(fontsize=8, loc="lower left")
axes[0].set_title("Senate races still out, by how much they matter\n(P(D) now in brackets)", fontsize=10)
axes[1].set_title("the 15 House races that matter most to the House\n(note the axis)", fontsize=10)
fig.tight_layout();
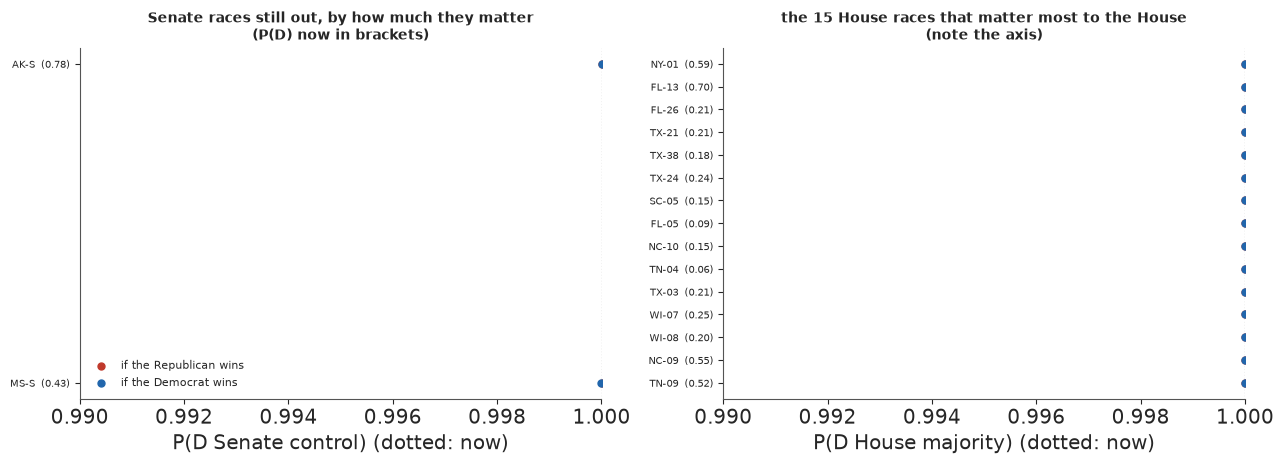
Two patterns hold while control is in doubt. A race matters most when it is likely to go one way and its loss would be a surprise: a Democratic loss in a race the Democrats were expected to win removes a seat they were counting on and says the polls were off. So the Senate races at the top of the left panel are often not the closest ones, but the likely Democratic wins that the Senate majority counts on. On the right, no single House race moves House control by much, because the majority is a sum of hundreds of races; the races at the top are likely Democratic seats whose loss would signal a broader miss. Watch the axis: it starts well above zero. Once control of a chamber is all but certain, as both are at the latest snapshot, the two answers for every race coincide and the panels collapse onto the dotted line: no race still out can change control, only the size of the majority.
6 · Silences and partial counts
6.1 "Too close to call" is data
A race that is not called when its polls close says something too. The AP waits when the count could still go either way, so an uncalled race is likely to be close. How close is a judgement: we read "too close" as $|m_r| < 3$ points and try 1.5 and 5 as well. The choice is ours, not the data's, so the table shows how much it matters at the latest snapshot. It applies only while a race is listed as too close; once the race is called, the call replaces it, and the log keeps both.
rows = []
for c in (None, 1.5, 3.0, 5.0):
    cl = calls if c is not None else calls[calls.status != "too close"]
    S = reweighted(info_from(cl, c if c is not None else CLOSE))
    row = {"too-close races read as": "no information" if c is None else f"|margin| < {c}", "ESS": round(S["ess"])}
    row.update({f"{r} P(D)": round(S["pD"][RACE[r]], 3) for r in closes})
    row.update({"P(D Senate)": round(S["P(Senate)"], 3), "P(D House)": round(S["P(House)"], 3),
                "polling error": "{1:+.1f} [{0:+.1f}, {2:+.1f}]".format(*wq(S["bias"], S["w"]))})
    rows.append(row)
print("races too close to call now:", closes or "none")
print(pd.DataFrame(rows).to_string(index=False))
ever = log[log.status == "too close"].race.unique().tolist()
print("races listed as too close at some snapshot:", ever or "none")
races too close to call now: ['MS-S']
too-close races read as  ESS  MS-S P(D)  P(D Senate)  P(D House)     polling error
         no information    2      0.362          1.0         1.0 -3.9 [-4.8, -3.8]
         |margin| < 1.5    2      0.477          1.0         1.0 -3.9 [-4.8, -3.8]
         |margin| < 3.0    2      0.455          1.0         1.0 -3.9 [-4.8, -3.8]
         |margin| < 5.0    2      0.428          1.0         1.0 -3.9 [-4.8, -3.8]
races listed as too close at some snapshot: ['FL-S', 'MS-S']
When no race is listed as too close, every row of the table is the same. When one is, read the first row against the others. A race that is too close in a state one party was expected to win comfortably says that party is not winning there by the margin the forecast expected, which points to a polling error against it, and through the shared error that moves every race. The narrower the reading, the stronger the pull.
Florida showed how much this can matter and how fragile it is. In the 20:20 snapshot its Senate race was too close to call. Read as $|m_r| < 3$, that one silence moved the chance of a Democratic Senate from 0.82 (calls only) to 0.93, more than all the calls together, because Moody had been expected to win by about five points. Half an hour later Fox called Florida for Moody, the interval became a one-sided call the forecast had expected, and most of that rise went away; the replay in section 3.1 shows the spike. An uncalled race is evidence, but how much depends on an assumption about what the silence means.
6.2 Partial counts, and the order ballots are counted
Many pages give a running count: Ossoff led 64-36 with 56% of the expected vote in. It is tempting to use it, and wrong to use it at face value. Ballots are counted in batches whose order depends on each state's rules, and the batches lean differently, because the voters who vote early, by mail and on the day are not the same people. In Georgia, Florida and North Carolina the early and mail ballots, which lean Democratic, are counted and reported first, so the count starts blue and drifts red as election-day precincts come in; Ossoff's 64-36 overstates his final margin by an amount nobody knows on the night. In Pennsylvania and Wisconsin mail ballots may not be processed before election day and often come last, so the drift runs the other way; in Arizona, Nevada and California, late-arriving mail and provisional ballots are counted for days. The same share counted means different things in different states.
So the log keeps partial counts, but a margin enters only once a race is at least 95% counted, and even then the ballots still out may differ from those counted. If the outstanding share $u$ could lean up to $k = 30$ points differently from the counted ballots, the final margin could differ from the count by about $k\,u$, so a near-final margin enters with sd $\sqrt{0.5^2 + (k u)^2}$: 1.5 points at 95% counted, 0.5 when the count is complete.
6.3 The margin is the message
A call tells us the sign of one margin; the margin tells us much more. The cell takes the closest Senate race called so far and refits the model for a range of final margins on the winner's side, each treated as a complete count, on top of all the night's calls. It also reports the ESS that reweighting would have had. The answer is a curve, not a number, while the final margin is unknown.
sc = calls[(calls.status == "called") & calls.race.str.endswith("-S")]
SWEEP = sc.assign(gap=(sc.pD - 0.5).abs()).sort_values("gap").race.iloc[0]
sgn = 1.0 if calls.set_index("race").winner[SWEEP] == "D" else -1.0
FINALS = sgn * np.array([1.0, 4.0, 8.0, 14.0])
others = [m_ for m_ in MARG if m_[0] != SWEEP]
rows, sweep = [], {}
t0 = time.time()
for y in FINALS:
    S = refit(INFO, [(SWEEP, y, tau_m(100))] + others)
    lw = np.log(weights(E, INFO)) + norm.logpdf(y, E["mu"][:, RACE[SWEEP]], tau_m(100))
    w_ = np.exp(lw - lw.max())
    sweep[y] = S
    rows.append({f"{SWEEP} final margin": f"{y:+.0f}", "P(D House)": round(S["P(House)"], 3),
                 "P(D Senate)": round(S["P(Senate)"], 3),
                 "N": "{1:+.1f} [{0:+.1f}, {2:+.1f}]".format(*np.quantile(S["N"], [0.05, 0.5, 0.95])),
                 "polling error": "{1:+.1f} [{0:+.1f}, {2:+.1f}]".format(*np.quantile(S["bias"], [0.05, 0.5, 0.95])),
                 "reweighting ESS": round(ess(w_ / w_.sum()), 1), "divergences": S["diag"]["divergences"]})
TIMES["margin refits"] = time.time() - t0
print(f"{SWEEP}: eve median {fz.pred[SWEEP]:+.1f} (80% interval {fz.q10[SWEEP]:+.1f} to {fz.q90[SWEEP]:+.1f}), "
      f"called for the {'Democrat' if sgn > 0 else 'Republican'}")
print(pd.DataFrame(rows).to_string(index=False))
IA-S: eve median +0.8 (80% interval -5.8 to +7.2), called for the Democrat
IA-S final margin  P(D House)  P(D Senate)                    N     polling error  reweighting ESS  divergences
               +1         1.0          1.0 +13.5 [+11.3, +15.6] -4.4 [-6.4, -2.4]              1.6            0
               +4         1.0          1.0 +13.6 [+11.5, +15.9] -4.6 [-6.7, -2.5]              1.0            0
               +8         1.0          1.0 +13.9 [+11.7, +16.1] -4.9 [-6.9, -3.0]              1.0            1
+14 1.0 1.0 +14.4 [+12.1, +16.5] -5.3 [-7.3, -3.3] 1.0 0fig, axes = plt.subplots(1, 2, figsize=(12, 3.6))
ax = axes[0]
for y, c in zip(FINALS, plt.cm.Greys(np.linspace(0.35, 1, len(FINALS)))):
ax.plot(gx, gaussian_kde(sweep[y]["bias"])(gx), color=c, label=f"{SWEEP} {y:+.0f}")
ax.plot(gx, gaussian_kde(S_CALLS["bias"])(gx), color=GOLD, ls=":", label="calls only")
ax.set_xlabel("shared polling error (+ = polls too Democratic)")
ax.set_yticks([])
ax.legend(fontsize=8)
ax.set_title(f"the polling error, given {SWEEP}'s final margin", fontsize=10)
ax = axes[1]
ax.plot(FINALS, [sweep[y]["P(House)"] for y in FINALS], "o-", color=D_C, label="House")
ax.plot(FINALS, [sweep[y]["P(Senate)"] for y in FINALS], "s-", color=GOLD, label="Senate")
ax.axhline(S_CALLS["P(House)"], color=D_C, ls=":", lw=0.8)
ax.axhline(S_CALLS["P(Senate)"], color=GOLD, ls=":", lw=0.8)
ax.axvline(fz.pred[SWEEP], color=MUTED, lw=0.8)
ax.text(fz.pred[SWEEP], 0.05, " eve median", color=MUTED, fontsize=8)
ax.set_xlabel(f"{SWEEP} final margin (points, D minus R)")
ax.set_ylabel("P(Democratic control)")
ax.set_ylim(0, 1.02)
ax.legend(fontsize=8, loc="lower right")
ax.set_title("control, given that margin (dotted: calls only)", fontsize=10)
fig.tight_layout();
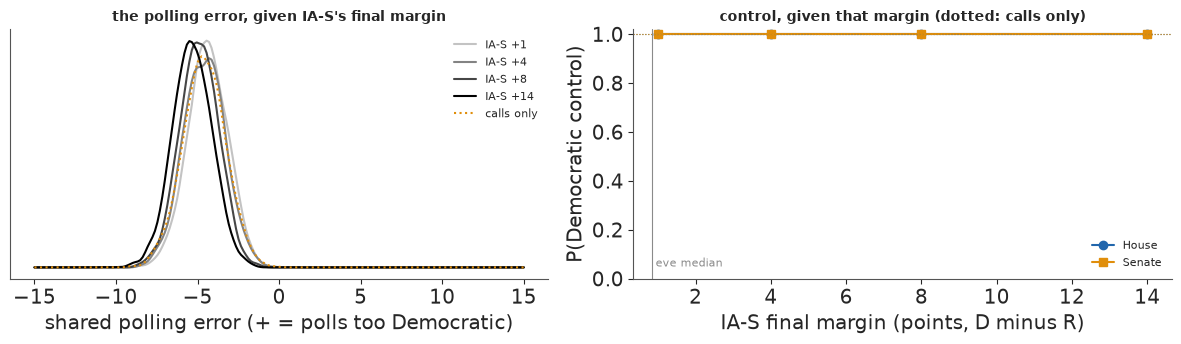
The margin matters in a way the call did not. Across the range, the polling error moves by several points and the chance of each chamber with it: a winner who runs ahead of the forecast says the polls understated their party, and every race still out moves toward it. The reweighting ESS column is the failure in numbers: conditioning on a margin known to within a point keeps only the eve draws that happened to land near it: a few dozen at best, and only a handful late in the night, when the calls have already narrowed the draws. A margin is strong data, and strong data need a refit.
7 · Where the night stands
The bulletin below is written by the code from the latest snapshot, so it is current whenever the notebook is rebuilt.
def iv(v, f, w=None):
    q_ = wq(v, w) if w is not None else np.quantile(v, [0.05, 0.5, 0.95])
    return f"{q_[1]:{f}} ({q_[0]:{f}} to {q_[2]:{f}})"


ncall = int((calls.status == "called").sum())
surpr = calls[calls.status == "called"].sort_values("surprise", ascending=False).head(3)
top_s = watch[watch.office == "S"].sort_values("Senate swing", ascending=False).head(3)
mv_top = mv.reindex(mv.change.abs().sort_values(ascending=False).index).head(5)
text = f"""**As of {AS_OF} ET**: {ncall} tracked races called, {len(closes)} too close to call
({", ".join(closes) or "none"}){"" if not MARG else
f", {len(MARG)} counted to at least {FINAL}% ({', '.join(r for r, *_ in MARG)})"}.
New since {prev_lab}: {", ".join(f"{r.race} {r.winner if r.status == 'called' else '(too close)'}"
                                 for r in new_rows.itertuples())}.

* **House:** P(Democratic majority) {S0['P(House)']:.2f} (eve {EVE['P(House)']:.2f}; the latest rows moved it by
  {S_LAST['P(House)'] - S_PREV['P(House)']:+.3f}); Democratic seats {iv(S0['H'], '.0f')}.
* **Senate:** P(Democratic control) {S0['P(Senate)']:.2f} (eve {EVE['P(Senate)']:.2f}; the latest rows moved it by
  {S_LAST['P(Senate)'] - S_PREV['P(Senate)']:+.3f}); Democratic-caucus seats {iv(S0['S'], '.0f')}.
* **The polls:** shared polling error {iv(S0['bias'], '+.1f')} points (eve {iv(EVE['bias'], '+.1f')}); national
  House margin {iv(S0['N'], '+.1f')} (eve {iv(EVE['N'], '+.1f')}).
* **Most surprising calls so far:** {"; ".join(f"{r_} for the {'Democrat' if w_ == 'D' else 'Republican'} "
  f"(eve chance {p_:.3f})" for r_, w_, p_ in zip(surpr.race, surpr.winner, surpr["P(result)"]))}.
* **Races still out that moved most since {prev_lab}** ({"two refits compared" if MOVE_HOW == "refit" else "reweighted draws"}): {"; ".join(f"{r.race} {r.previous:.2f} to {r.latest:.2f}"
  for r in mv_top.itertuples())}.
* **Had {flip} gone the other way:** P(D House) {S_FLIP['P(House)']:.2f}, P(D Senate) {S_FLIP['P(Senate)']:.2f}.
* **Senate races to watch:** {"; ".join(f"{r.race} (P(D) {r._3:.2f}; control {r._6:.2f} if D, {r._7:.2f} if R)"
  for r in top_s.itertuples())}.
* Reweighting and refit agree to {gap.max():.3f} in the race chances (reweighting ESS
  {S_snap[SNAPS[-1]]['ess']:.0f} of {len(EVE['w'])}).
"""
display(Markdown(text))


def gauge(ax, p, p_eve, label):
    """A half-dial from a certain Republican win (left) to a certain Democratic win (right)."""
    rb = plt.get_cmap("RdBu")
    for k in range(90):
        ax.add_patch(Wedge((0, 0), 1, 180 - 2 * (k + 1), 180 - 2 * k, width=0.28, color=rb(0.08 + 0.84 * k / 89)))
    for q, a in ((p_eve, GOLD), (p, INK)):
        ang = np.radians(180 * (1 - q))
        if a == GOLD:
            ax.plot([0.68 * np.cos(ang), 1.06 * np.cos(ang)], [0.68 * np.sin(ang), 1.06 * np.sin(ang)], color=GOLD, lw=3)
        else:
            ax.plot([0, 0.86 * np.cos(ang)], [0, 0.86 * np.sin(ang)], color=INK, lw=4, solid_capstyle="round")
    ax.add_patch(Circle((0, 0), 0.06, color=INK))
    pct = "> 99%" if p > 0.995 else ("< 1%" if p < 0.005 else f"{100 * p:.0f}%")
    ax.text(0, -0.3, pct, ha="center", va="center", fontsize=34, weight="bold", color=D_C if p >= 0.5 else R_C)
    ax.text(0, -0.58, label, ha="center", va="center", fontsize=11, color=INK)
    ax.text(-1.0, -0.1, "R", ha="center", fontsize=12, weight="bold", color=R_C)
    ax.text(1.0, -0.1, "D", ha="center", fontsize=12, weight="bold", color=D_C)
    ax.set_xlim(-1.2, 1.2)
    ax.set_ylim(-0.72, 1.12)
    ax.set_aspect("equal")
    ax.set_axis_off()


def seat_bars(ax, v, need, total, label, w=None, xlim=None):
    w = np.full(len(v), 1 / len(v)) if w is None else w
    e = np.arange(v.min() - 0.5, v.max() + 1.5)
    cnt, _ = np.histogram(v, e, weights=w)
    mid = e[:-1] + 0.5
    ax.bar(mid, cnt, width=1.0, color=np.where(mid >= need, D_C, R_C), alpha=0.8)
    ax.axvline(need - 0.5, color=INK, lw=1, ls=":")
    if xlim is not None:
        ax.set_xlim(*xlim)
    lo, med, hi = np.round(wq(v.astype(float), w))
    spare = int(round(med)) - need
    how = (f"{spare} more than the {need} a majority needs" if spare > 0 else
           "exactly a majority" if spare == 0 else f"{-spare} short of the {need} a majority needs")
    ax.set_title(f"{label}: {med:.0f} Democratic seats (90%: {lo:.0f} to {hi:.0f}),\n{how}", fontsize=10)
    ax.set_yticks([])
    ax.xaxis.set_major_locator(plt.MaxNLocator(integer=True))
    ax.set_xlabel("Democratic seats (dotted: majority line)")


fig = plt.figure(figsize=(12, 5.8))
gs_ = fig.add_gridspec(2, 2, height_ratios=[1.25, 0.75], hspace=0.05)
gauge(fig.add_subplot(gs_[0, 0]), S0["P(House)"], EVE["P(House)"], "chance the Democrats win the House")
gauge(fig.add_subplot(gs_[0, 1]), S0["P(Senate)"], EVE["P(Senate)"], "chance the Democrats control the Senate")
seat_bars(fig.add_subplot(gs_[1, 0]), S0["H"], 218, 435, "House")
seat_bars(fig.add_subplot(gs_[1, 1]), S0["S"], 51, 100, "Senate (34 seats not up included)")
fig.suptitle(f"Election night, as of {AS_OF[-5:]} ET on {int(AS_OF[8:10])} November: {ncall} tracked races called "
             f"(eve forecast: House {EVE['P(House)']:.0%}, Senate {EVE['P(Senate)']:.0%}, gold ticks)", fontsize=12)
GLANCE.update(fig)
plt.close(fig)
As of 2026-11-04 17:22 ET: 69 tracked races called, 1 too close to call (MS-S), 3 counted to at least 95% (MS-S, LA-S, MI-10). New since 16:22: NE-01 R.
- House: P(Democratic majority) 1.00 (eve 0.95; the latest rows moved it by +0.000); Democratic seats 271 (260 to 284).
- Senate: P(Democratic control) 1.00 (eve 0.80; the latest rows moved it by +0.000); Democratic-caucus seats 55 (54 to 56).
- The polls: shared polling error -4.9 (-7.0 to -2.8) points (eve +1.0 (-3.7 to +5.8)); national House margin +13.9 (+11.7 to +16.2) (eve +8.0 (+3.2 to +12.8)).
- Most surprising calls so far: IN-05 for the Democrat (eve chance 0.180); OH-15 for the Democrat (eve chance 0.200); TX-23 for the Democrat (eve chance 0.261).
- Races still out that moved most since 16:22 (two refits compared): NJ-02 0.34 to 0.30; KS-02 0.38 to 0.34; NY-21 0.43 to 0.39; MN-08 0.28 to 0.24; CO-05 0.84 to 0.81.
- Had NE-01 gone the other way: P(D House) 1.00, P(D Senate) 1.00.
- Senate races to watch: AK-S (P(D) 0.78; control 1.00 if D, 1.00 if R); MS-S (P(D) 0.43; control 1.00 if D, 1.00 if R).
- Reweighting and refit agree to 0.707 in the race chances (reweighting ESS 2 of 4000).
7.1 The night as it came in
The same gauges, one frame per row of the log, from the eve forecast to the latest; press play, or drag the slider to step through the night one call at a time. The strip at the bottom traces both chances across the calls, with the hourly snapshots marked, so a call that moved a chamber shows as a step. The log records the snapshot a call was entered in, not its minute, so within a snapshot the calls appear in the order they were logged.
Refitting at every call would cost half a minute of sampling per frame. Instead each frame reweights the draws of the most recent fit (the eve, to begin with) by what the log has added since it, with the likelihood ratio of the new information to the old; that is exact importance sampling, and it stays cheap while only a few calls separate a frame from its fit. When the ESS falls below 500, the frame is refitted by NUTS and the later frames reweight that refit instead. The last frame is the refit the gauges at the top show. The same frames are saved as an animated GIF, E95_election_night.gif, to paste into a message or a slide.
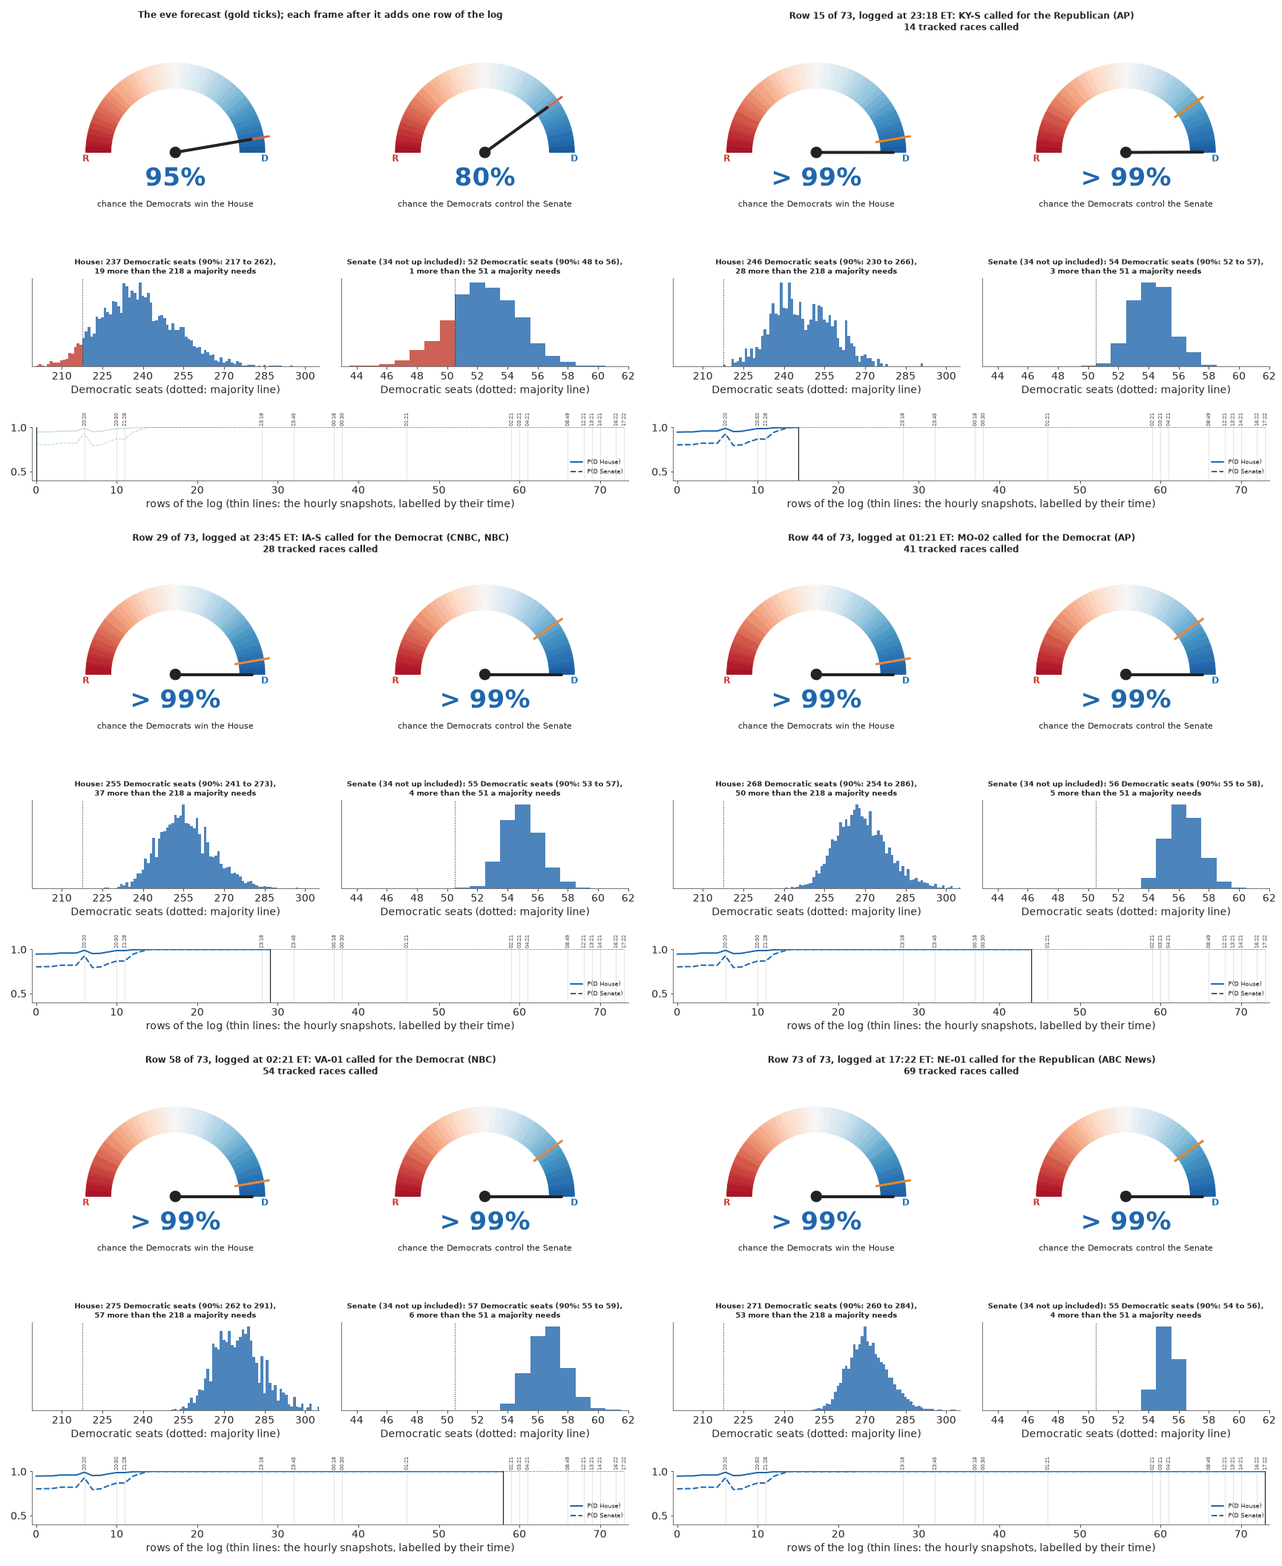
from matplotlib import animation
from IPython.display import HTML

FRAME_ESS = 500
WHO = {"D": "the Democrat", "R": "the Republican"}


def loglik_all(E_, info, margins):
    """Log likelihood of the night's information (calls, too-close intervals, counted margins), per draw."""
    lw = np.zeros(E_["mu"].shape[0])
    for race, lo, hi in info:
        i = RACE[race]
        lw += loglik(E_["mu"][:, i], E_["sd"][:, i], lo, hi)
    for race, y, m_sd in margins:
        i = RACE[race]
        lw += norm.logpdf(y, E_["mu"][:, i], np.sqrt(E_["sd"][:, i] ** 2 + m_sd**2))
    return lw


def describe_row(r):
    what = (f"called for {WHO[r.winner]}" if r.status == "called" else "too close to call")
    if pd.notna(r.pct_expected_in):
        what += f", {r.d_pct:g}-{r.r_pct:g} with {r.pct_expected_in:g}% counted"
    return f"{r.race} {what} ({r.reported_by})"


t0 = time.time()
FRAMES = [("The eve forecast", EVE, "eve")]
E_a, info_a, marg_a, ll_a = E, [], [], np.zeros(E["mu"].shape[0])
n_refit = 0
for k, r in enumerate(log.itertuples()):
    st_ = log.iloc[: k + 1].groupby("race", sort=False).tail(1)
    info_k, marg_k = info_from(st_), margins_from(st_)
    if k == len(log) - 1:
        S_ = S0
    else:
        lw = loglik_all(E_a, info_k, marg_k) - ll_a
        w = np.exp(lw - lw.max())
        w /= w.sum()
        if ess(w) >= FRAME_ESS:
            S_ = summarise(E_a, info_k, w)
        else:
            E_a = eve_draws(d, night_fit(d, info_k, marg_k))
            info_a, marg_a, ll_a = info_k, marg_k, loglik_all(E_a, info_k, marg_k)
            S_ = summarise(E_a, info_k)
            n_refit += 1
    n_ = int((st_.status == "called").sum())
    FRAMES.append((f"Row {k + 1} of {len(log)}, logged at {r.t:%H:%M} ET: {describe_row(r)}\n"
                   f"{n_} tracked races called", S_, r.t.strftime("%H:%M")))
del E_a
TIMES["call-by-call refits"] = time.time() - t0
TRACE = pd.DataFrame({"House": [S_["P(House)"] for _, S_, _ in FRAMES],
                      "Senate": [S_["P(Senate)"] for _, S_, _ in FRAMES]})
snap_at = [k for k in range(1, len(FRAMES)) if k == len(FRAMES) - 1 or FRAMES[k + 1][2] != FRAMES[k][2]]
h_lim = (min(np.quantile(S_["H"], 0.001) for _, S_, _ in FRAMES) - 3,
         max(np.quantile(S_["H"], 0.999) for _, S_, _ in FRAMES) + 3)
s_lim = (min(S_["S"].min() for _, S_, _ in FRAMES) - 1, max(S_["S"].max() for _, S_, _ in FRAMES) + 1)
fig = plt.figure(figsize=(12, 9.8), dpi=72, layout="none")      # fixed axes, so the frames do not jump
gs_ = fig.add_gridspec(3, 2, height_ratios=[1.4, 0.75, 0.45], hspace=0.6, wspace=0.08,
                       top=0.9, bottom=0.08, left=0.05, right=0.98)
axs = [fig.add_subplot(gs_[0, 0]), fig.add_subplot(gs_[0, 1]), fig.add_subplot(gs_[1, 0]),
       fig.add_subplot(gs_[1, 1]), fig.add_subplot(gs_[2, :])]
title = fig.suptitle("", fontsize=12)


def show_frame(k):
    lab, S_, _ = FRAMES[k]
    for ax in axs:
        ax.clear()
    gauge(axs[0], S_["P(House)"], EVE["P(House)"], "chance the Democrats win the House")
    gauge(axs[1], S_["P(Senate)"], EVE["P(Senate)"], "chance the Democrats control the Senate")
    seat_bars(axs[2], S_["H"], 218, 435, "House", S_["w"], h_lim)
    seat_bars(axs[3], S_["S"], 51, 100, "Senate (34 not up included)", S_["w"], s_lim)
    ax = axs[4]
    for j in snap_at:
        ax.axvline(j, color=INK, lw=0.5, alpha=0.25)
        ax.text(j, 1.01, FRAMES[j][2], fontsize=7, ha="center", va="bottom", rotation=90, color=INK, alpha=0.7)
    ax.plot(TRACE.index, TRACE.House, color=D_C, lw=1, alpha=0.35)
    ax.plot(TRACE.index, TRACE.Senate, color=D_C, lw=1, ls="--", alpha=0.35)
    ax.plot(TRACE.index[: k + 1], TRACE.House[: k + 1], color=D_C, lw=2, label="P(D House)")
    ax.plot(TRACE.index[: k + 1], TRACE.Senate[: k + 1], color=D_C, lw=2, ls="--", label="P(D Senate)")
    ax.axvline(k, color=INK, lw=1.2)
    ax.set_xlim(-0.5, len(FRAMES) - 0.5)
    ax.set_ylim(min(0.4, TRACE.values.min() - 0.05), 1.0)
    ax.set_xlabel("rows of the log (thin lines: the hourly snapshots, labelled by their time)")
    ax.legend(loc="lower right", fontsize=8, frameon=False)
    title.set_text(lab if k else "The eve forecast (gold ticks); each frame after it adds one row of the log")
    return axs


show_frame(0)
anim = animation.FuncAnimation(fig, show_frame, frames=len(FRAMES), interval=700)
plt.close(fig)
with warnings.catch_warnings(), plt.rc_context({"figure.constrained_layout.use": False}):  # saving re-reads the style
    warnings.simplefilter("ignore", UserWarning)
    anim_html = anim.to_jshtml(default_mode="once")
step = TRACE.diff().abs()
print(f"{len(FRAMES)} frames, {n_refit} refits along the way (ESS floor {FRAME_ESS})")
for c in ["House", "Senate"]:
    j = int(step[c].idxmax())
    print(f"largest single-row step in P(D {c}): {TRACE[c][j - 1]:.3f} -> {TRACE[c][j]:.3f}, "
          f"{FRAMES[j][0].splitlines()[0]}")

from PIL import Image                                    # installed with matplotlib

GIF = "E95_election_night.gif"                           # written next to the notebook, to paste elsewhere
gif = []
with plt.rc_context({"figure.constrained_layout.use": False}):
    for k in range(len(FRAMES)):
        show_frame(k)
        buf = io.BytesIO()
        fig.savefig(buf, format="png", dpi=fig.dpi)      # the figure is closed, so save rather than draw
        rgb = Image.open(buf).convert("RGB")
        gif.append(rgb.quantize(colors=128, method=Image.Quantize.MEDIANCUT, dither=Image.Dither.NONE))
gif[0].save(GIF, save_all=True, append_images=gif[1:], loop=0, optimize=True,
            duration=[2000] + [700] * (len(gif) - 2) + [4000])   # hold the eve and the latest frame
print(f"wrote {GIF}: {len(gif)} frames, {os.path.getsize(GIF) / 1e6:.1f} MB")
HTML(anim_html)
74 frames, 4 refits along the way (ESS floor 500)
largest single-row step in P(D House): 0.989 -> 0.951, Row 7 of 73, logged at 20:50 ET: FL-S called for the Republican (Fox)
largest single-row step in P(D Senate): 0.926 -> 0.793, Row 7 of 73, logged at 20:50 ET: FL-S called for the Republican (Fox)
wrote E95_election_night.gif: 74 frames, 1.5 MB
TIMES["total"] = time.time() - T_START
print({k: round(v) for k, v in TIMES.items()})
{'eve fit': 35, 'latest refits': 367, 'counterfactual refit': 251, 'margin refits': 684, 'call-by-call refits': 276, 'total': 1704}Summary
- A call moves the map in proportion to its surprise. The night's first call, Georgia for Ossoff, had been given a 0.994 chance; it carried 0.007 nats and moved the chance of a Democratic Senate from 0.801 to 0.804. A Collins win, at 0.0065, would have moved both chambers by tens of points. The calls that reshape the election are the ones the forecast did not expect, and the replay in section 3 shows which they were.
- A call is an interval on the margin. With the race's own noise integrated out, its likelihood is a normal CDF of the race's mean margin; "too close to call" is an interval around zero, and its reading is an assumption that can be the night's largest effect, as Florida's silence was for half an hour.
- Reweighting is exact but fragile. Weighting the frozen draws by the likelihood of the calls agrees
with a NUTS refit with a
Potentialto a few thousandths per race on average while the ESS stays in the hundreds or more. A surprising result or a margin known to a point needs the refit, which takes half a minute. - Partial counts lean by the order ballots are counted. Early and mail ballots come first in some states and last in others, so a running margin is not a sample of the final one. Margins enter only from 95% counted, with an sd that grows with the share still out; a final margin then says much more than the call did.
- Conditional forecasts tell you what to watch. For each race still out, the chance of control if either side wins it measures how much it matters, through the seat and through what it says about the polls. While control was in doubt, Senate control hung most on the likely Democratic wins the majority counted on, and no single House race moved House control by much. By 23:18, with Democratic wins in Ohio, Texas and South Carolina, the calls had settled both chambers in the model, and the races still out decide only the size of the majorities.
Try it yourself
- Call times as data. A race called the moment its polls close is not close, and one called at 2 am is. Record the minutes between poll closing and the call, model the call time as a function of the true margin (for example, called at closing when $|m_r|$ exceeds a threshold with a logistic edge), and use it in place of the bare call. How much more do the early calls say?
- Partial counts with a skew. Model a partial count as the final margin plus a reporting shift that depends on which ballots are counted first, with a state-specific shift learned from 2018 and 2022 county returns by reporting time. When does a running count become more informative than the call?
- Score the night. Once every race is called, compare the log scores of the frozen forecast and of each snapshot's forecast on the races still out at that snapshot. Did updating on the calls improve the forecasts of the races that came in later?