Every challenge in this repository assumes you can do what is on this page without thinking. It is also a tour of what changed if you learned PyMC a few versions ago:
| Then | Now (PyMC 6 / ArviZ 1) |
|---|---|
pm.sample returns InferenceData |
returns an xarray DataTree; groups work the same (idata.posterior["x"]) |
pm.MutableData, pm.ConstantData |
just pm.Data |
az.plot_posterior, az.plot_ppc |
az.plot_dist, az.plot_ppc_dist (and a family of plot_ppc_*) |
az.summary shows 94% HDI |
shows an 89% equal-tailed interval by default; ask for what you want with ci_kind=, ci_prob= |
| plots return matplotlib axes | plots return a PlotCollection |
pm.sample uses PyMC's NUTS |
uses nutpie automatically when it is installed |
import arviz as az
import matplotlib.pyplot as plt
import numpy as np
import pandas as pd
import pymc as pm

from pymc_challenges import data

RANDOM_SEED = 42
rng = np.random.default_rng(RANDOM_SEED)
az.style.use("arviz-variat")

print(f"PyMC {pm.__version__}, ArviZ {az.__version__}")
PyMC 6.3.2, ArviZ 1.3.0
1 · Question and data
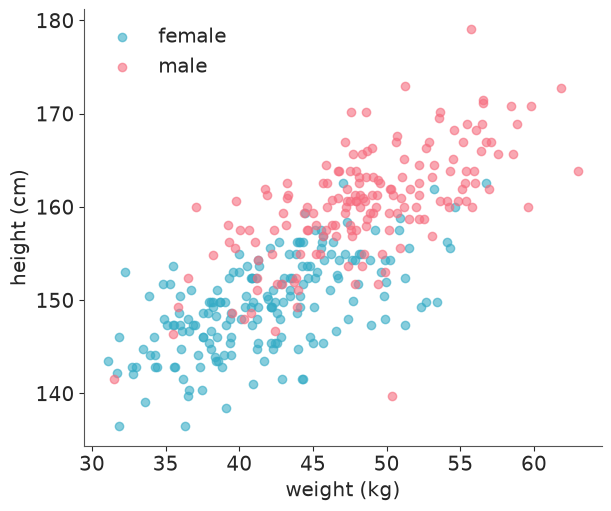
How does height depend on weight among adults, and does it differ by sex? A deliberately simple question, so the workflow is the star.
data.describe("howell")
howell = data.load("howell")
adults = howell[howell.age >= 18].reset_index(drop=True)
adults["sex"] = np.where(adults.male == 1, "male", "female")
adults.describe().round(1)
howell: Height (cm), weight (kg), age and sex of 544 individuals.
  source: Nancy Howell's Dobe !Kung census (1960s), via McElreath's `rethinking`.
  url:    https://raw.githubusercontent.com/rmcelreath/rethinking/master/data/Howell1.csv
| height | weight | age | male | |
|---|---|---|---|---|
| count | 352.0 | 352.0 | 352.0 | 352.0 |
| mean | 154.6 | 45.0 | 41.1 | 0.5 |
| std | 7.7 | 6.5 | 16.0 | 0.5 |
| min | 136.5 | 31.1 | 18.0 | 0.0 |
| 25% | 148.6 | 40.3 | 28.0 | 0.0 |
| 50% | 154.3 | 44.8 | 39.0 | 0.0 |
| 75% | 160.7 | 49.3 | 51.0 | 1.0 |
| max | 179.1 | 63.0 | 88.0 | 1.0 |
fig, ax = plt.subplots()
for sex, grp in adults.groupby("sex"):
    ax.scatter(grp.weight, grp.height, label=sex, alpha=0.6)
ax.set(xlabel="weight (kg)", ylabel="height (cm)")
ax.legend();
2 · Write the model down
$$ \begin{aligned} \text{height}_i &\sim \text{Normal}(\mu_i, \sigma) \\ \mu_i &= \alpha_{\text{sex}[i]} + \beta\,(\text{weight}_i - \bar{w}) \end{aligned} $$
Centring weight makes $\alpha$ "the height of a person of average weight", which is something
we can put a prior on from general knowledge: adults are roughly 150-180 cm. For $\beta$,
one extra kilogram is not going to add 10 cm; Normal(0, 1) cm/kg is generous. We will
check those claims rather than trust them.
Three habits worth forming, all visible below:
coordsanddimsname the axes of your model. Every output is then labelled, and you index by"female"instead of0.pm.Dataregisters inputs with the model so you can swap them later for prediction.- Index variables (
alpha[sex_idx]) instead of dummy columns - they scale to hierarchies.
sex_idx, sexes = pd.factorize(adults.sex, sort=True)
weight_mean = adults.weight.mean()

coords = {"sex": sexes, "obs": adults.index}

with pm.Model(coords=coords) as model:
    weight_c = pm.Data("weight_c", adults.weight - weight_mean, dims="obs")
    sex_id = pm.Data("sex_id", sex_idx, dims="obs")

    alpha = pm.Normal("alpha", 165, 15, dims="sex")
    beta = pm.Normal("beta", 0, 1)
    sigma = pm.HalfNormal("sigma", 10)

    mu = alpha[sex_id] + beta * weight_c
    # shape=mu.shape lets the observed variable resize when we swap in new data later
    pm.Normal("height", mu, sigma, observed=adults.height, dims="obs", shape=mu.shape)

model
3 · Prior predictive check: what do the priors claim?
Before the data gets a say, simulate from the priors. If the simulated heights include 3-metre people or negative heights, the prior is saying something you do not believe.
with model:
    idata = pm.sample_prior_predictive(500, random_seed=RANDOM_SEED)

idata
<xarray.DataTree>
Group: /
├── Group: /prior
│       Dimensions:  (chain: 1, draw: 500, sex: 2)
│       Coordinates:
│         * chain    (chain) int64 8B 0
│         * draw     (draw) int64 4kB 0 1 2 3 4 5 6 7 ... 493 494 495 496 497 498 499
│         * sex      (sex) <U6 48B 'female' 'male'
│       Data variables:
│           alpha    (chain, draw, sex) float64 8kB 140.3 186.1 175.9 ... 163.3 149.0
│           beta     (chain, draw) float64 4kB 1.254 0.6063 -1.34 ... -0.01451 0.7201
│           sigma    (chain, draw) float64 4kB 4.183 6.056 0.2879 ... 6.415 9.556 9.914
│       Attributes:
│           created_at:                 2026-09-19T18:35:51.686483+00:00
│           creation_library:           ArviZ
│           creation_library_version:   1.3.0
│           creation_library_language:  Python
│           inference_library:          pymc
│           inference_library_version:  6.3.2
│           sample_dims:                ['chain', 'draw']
├── Group: /prior_predictive
│       Dimensions:  (chain: 1, draw: 500, obs: 352)
│       Coordinates:
│         * chain    (chain) int64 8B 0
│         * draw     (draw) int64 4kB 0 1 2 3 4 5 6 7 ... 493 494 495 496 497 498 499
│         * obs      (obs) int64 3kB 0 1 2 3 4 5 6 7 ... 344 345 346 347 348 349 350 351
│       Data variables:
│           height   (chain, draw, obs) float64 1MB 189.2 135.7 117.2 ... 167.9 149.3
│       Attributes:
│           created_at:                 2026-09-19T18:35:51.687515+00:00
│           creation_library:           ArviZ
│           creation_library_version:   1.3.0
│           creation_library_language:  Python
│           inference_library:          pymc
│           inference_library_version:  6.3.2
│           sample_dims:                ['chain', 'draw']
├── Group: /observed_data
│       Dimensions:  (obs: 352)
│       Coordinates:
│         * obs      (obs) int64 3kB 0 1 2 3 4 5 6 7 ... 344 345 346 347 348 349 350 351
│       Data variables:
│           height   (obs) float64 3kB 151.8 139.7 136.5 156.8 ... 162.6 156.2 158.8
│       Attributes:
│           created_at:                 2026-09-19T18:35:51.687974+00:00
│           creation_library:           ArviZ
│           creation_library_version:   1.3.0
│           creation_library_language:  Python
│           inference_library:          pymc
│           inference_library_version:  6.3.2
│           sample_dims:                []
└── Group: /constant_data
        Dimensions:   (obs: 352)
        Coordinates:
          * obs       (obs) int64 3kB 0 1 2 3 4 5 6 7 ... 345 346 347 348 349 350 351
        Data variables:
            weight_c  (obs) float64 3kB 2.835 -8.505 -13.13 8.051 ... 7.173 9.072 7.541
            sex_id    (obs) int32 1kB 1 0 0 1 0 1 0 1 0 1 0 1 ... 1 0 1 0 1 0 0 0 1 0 1
        Attributes:
            created_at:                 2026-09-19T18:35:51.688458+00:00
            creation_library:           ArviZ
            creation_library_version:   1.3.0
            creation_library_language:  Python
            inference_library:          pymc
            inference_library_version:  6.3.2
sample_dims: []That is a DataTree: a tree of xarray Datasets. Groups are attributes or keys, and
everything inside is a labelled array.
prior_heights = idata.prior_predictive["height"]
print(prior_heights.dims, prior_heights.shape)
print("share of simulated heights outside 100-230 cm:",
      float(((prior_heights < 100) | (prior_heights > 230)).mean().round(3)))
('chain', 'draw', 'obs') (1, 500, 352)
share of simulated heights outside 100-230 cm: 0.002
prior = az.extract(idata, group="prior", num_samples=80, random_seed=RANDOM_SEED)
w = np.linspace(-15, 20, 50)
fig, ax = plt.subplots()
for a, b in zip(prior["alpha"].sel(sex="female").values, prior["beta"].values):
ax.plot(w + weight_mean, a + b * w, color="C0", alpha=0.25)
ax.axhspan(140, 190, color="k", alpha=0.08, label="plausible adult heights")
ax.set(xlabel="weight (kg)", ylabel="height (cm)", title="Regression lines implied by the prior")
ax.legend();
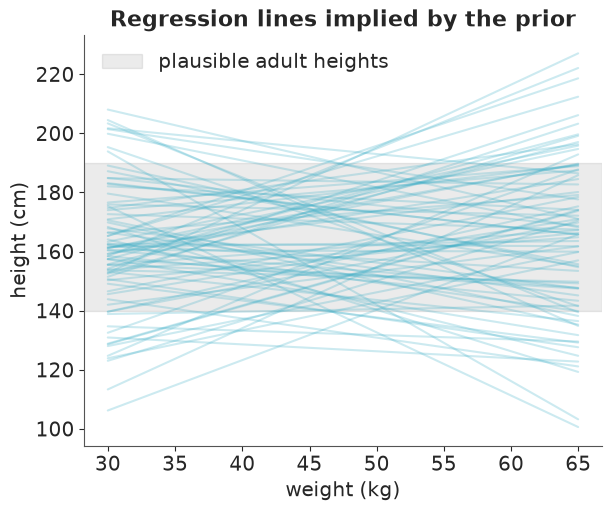
Wide, includes negative slopes we do not really believe in, but nothing crazy. Good enough: the goal of a weakly-informative prior is to rule out the absurd, not to win the argument.
4 · Sample
pm.sample() defaults to 4 chains of 1000 kept draws with NUTS. The warm-up length depends on
the sampler: 400 steps under nutpie (the default here), 1000 under PyMC's own NUTS. Pass
tune= explicitly when a model needs longer adaptation, and read what actually happened from
idata.posterior.attrs["tuning_steps"].
idata.update(...) merges the new groups into the tree we already have.
Another change from older versions: when nutpie (a Rust implementation of NUTS) is
installed - and it is in this environment - pm.sample() uses it by default. The log
line NUTS[nutpie] tells you so. Pass nuts_sampler="pymc" to get PyMC's own sampler;
the two can behave differently on hard geometries, which is worth remembering whenever
you compare divergence counts with a tutorial.
with model:
    idata.update(pm.sample(random_seed=RANDOM_SEED))

list(idata.children)
['prior',
 'prior_predictive',
 'observed_data',
 'constant_data',
 'posterior',
 'sample_stats']
5 · Diagnose before you interpret
The order matters. Until the sampler has demonstrably worked, the numbers mean nothing.
r_hat≤ 1.01: chains agree with one another.ess_bulk,ess_tailin the hundreds at least: enough effective draws for means and for interval endpoints.- Divergences = 0: NUTS did not hit regions it could not integrate accurately.
# round_to=2 fixes the decimals; the default "auto" keeps 2 significant figures, which is too coarse for alpha
az.summary(idata, ci_kind="hdi", ci_prob=0.94, round_to=2)
| mean | sd | hdi94_lb | hdi94_ub | ess_bulk | ess_tail | r_hat | mcse_mean | mcse_sd | |
|---|---|---|---|---|---|---|---|---|---|
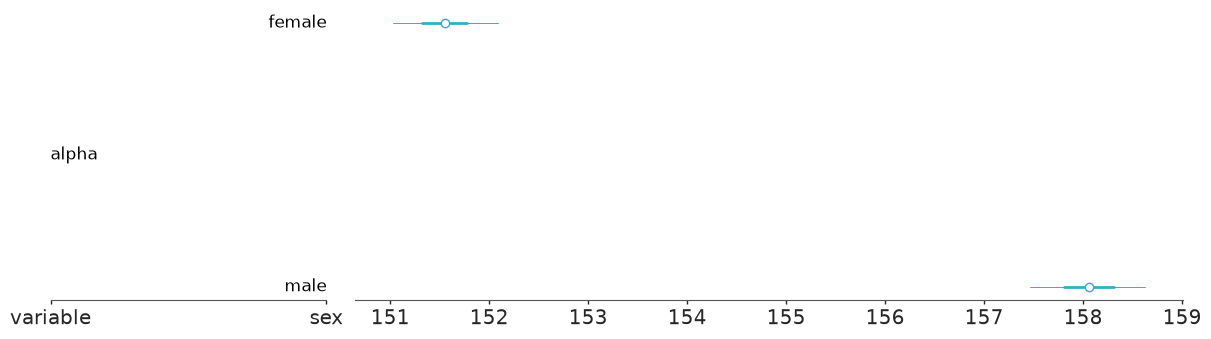
| alpha[female] | 151.55 | 0.34 | 150.94 | 152.19 | 3255.56 | 3255.31 | 1.0 | 0.01 | 0.00 |
| alpha[male] | 158.06 | 0.37 | 157.37 | 158.74 | 3524.44 | 2969.71 | 1.0 | 0.01 | 0.01 |
| beta | 0.64 | 0.04 | 0.56 | 0.72 | 3097.26 | 2677.12 | 1.0 | 0.00 | 0.00 |
| sigma | 4.29 | 0.17 | 3.99 | 4.62 | 5203.19 | 3469.06 | 1.0 | 0.00 | 0.00 |
print("divergences:", int(idata.sample_stats["diverging"].sum()))
az.plot_trace_dist(idata);
divergences: 0
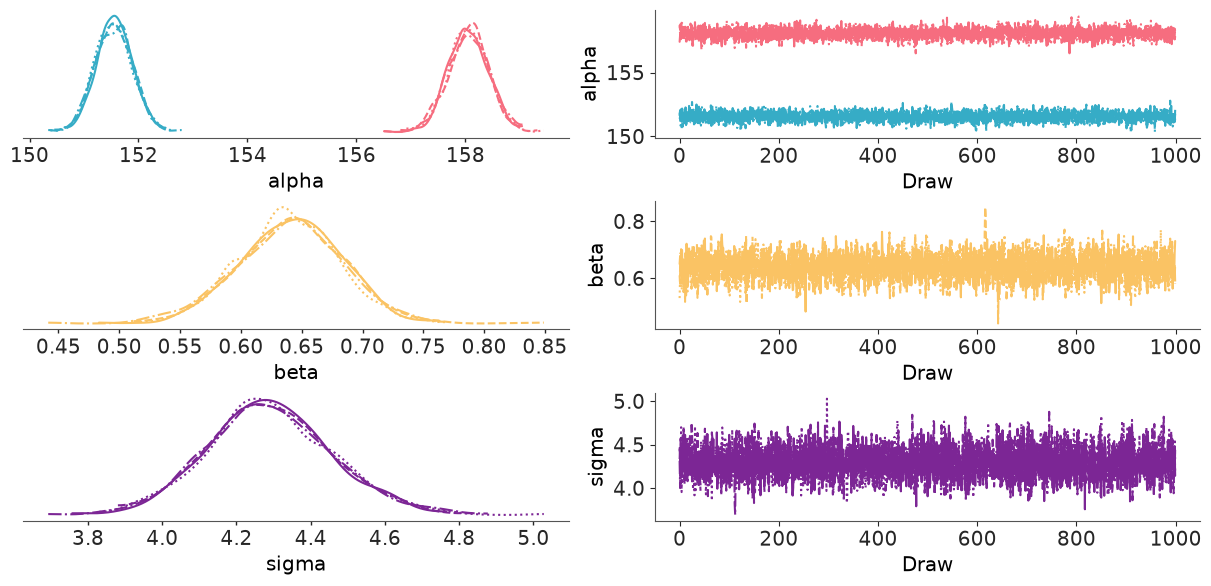
Rank plots are a sharper diagnostic than trace plots: if the chains target the same distribution, each chain's ranks are uniform.
az.plot_rank(idata);

6 · Posterior predictive check: can the model reproduce the data?
with model:
    pm.sample_posterior_predictive(idata, extend_inferencedata=True, random_seed=RANDOM_SEED)

az.plot_ppc_dist(idata);
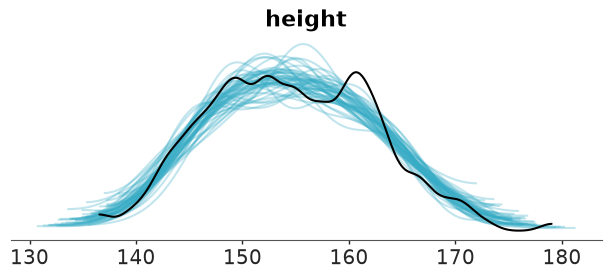
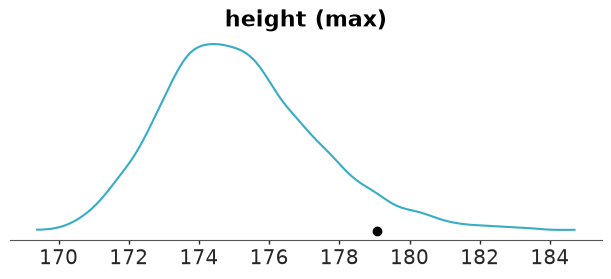
The observed distribution (dark line) sits inside the cloud of replicated datasets. A density overlay is a blunt instrument, so also check a statistic the model was not directly fitted to - here, the tallest person.
az.plot_ppc_tstat(idata, t_stat="max");
7 · Interpret
Work with the posterior as labelled arrays. Because alpha has a sex dimension, the
difference between sexes is a one-liner, with full uncertainty.
post = idata.posterior
diff = post["alpha"].sel(sex="male") - post["alpha"].sel(sex="female")

print(f"males are taller at equal weight by {float(diff.mean()):.1f} cm")
print("94% HDI:", az.hdi(diff, prob=0.94).values.round(1))
print(f"P(difference > 5 cm) = {float((diff > 5).mean()):.2f}")
males are taller at equal weight by 6.5 cm
94% HDI: [5.5 7.5]
P(difference > 5 cm) = 1.00
az.plot_forest(idata, var_names=["alpha"], combined=True);
8 · Predict for new inputs
Because inputs were registered with pm.Data, prediction is: swap the data, sample the
posterior predictive. predictions=True stores results in a separate predictions group.
New coordinates are needed because the obs dimension changes length.
new = pd.DataFrame({"weight": [35.0, 45.0, 55.0, 65.0], "sex": ["female", "female", "male", "male"]})

with model:
    pm.set_data(
        {"weight_c": new.weight - weight_mean, "sex_id": pd.Categorical(new.sex, categories=sexes).codes},
        coords={"obs": new.index},
    )
    pred = pm.sample_posterior_predictive(idata, predictions=True, random_seed=RANDOM_SEED)

pred_height = pred.predictions["height"]
new["mean"] = pred_height.mean(("chain", "draw")).values.round(1)
new[["lo", "hi"]] = az.hdi(pred_height, prob=0.94).values.round(1)
new
| weight | sex | mean | lo | hi | |
|---|---|---|---|---|---|
| 0 | 35.0 | female | 145.1 | 137.1 | 153.1 |
| 1 | 45.0 | female | 151.4 | 143.1 | 159.2 |
| 2 | 55.0 | male | 164.4 | 155.8 | 172.0 |
| 3 | 65.0 | male | 170.9 | 163.0 | 179.1 |
Those are predictive intervals for an individual (they include $\sigma$), not intervals for the mean. Know which one your stakeholder is asking for.
9 · Criticise and iterate
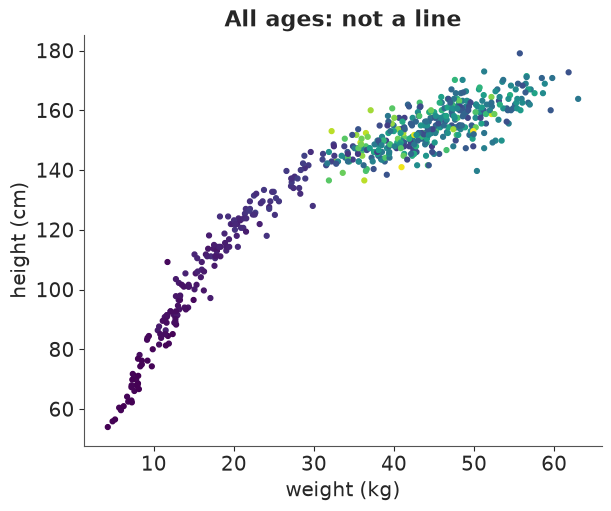
The model is fine for adults. Include the children and a straight line is hopeless:
fig, ax = plt.subplots()
ax.scatter(howell.weight, howell.height, c=howell.age, cmap="viridis", s=12)
ax.set(xlabel="weight (kg)", ylabel="height (cm)", title="All ages: not a line");
Try it yourself
- Refit on all ages with
log(weight)as the predictor. Is the PPC acceptable? - Let the slope differ by sex (
betawithdims="sex"). Does the data support it? Compare withaz.compare(you will needpm.compute_log_likelihood). - Replace the Normal likelihood with
StudentT. What happens tosigmaand to the predictive intervals?
Next: E02 for hierarchical models, or jump into challenge C01.