Centering in Panel Models

A detailed analysis of centering and some normalization missadventures in panel regression WIP
Author

Matthew Reda

Abstract

Panel regression models analyze data from the same units observed over multiple time periods, enabling control for time-invariant unobserved unit characteristics and estimation of within-unit effects. A common technique, particularly in fixed-effects models, involves “demeaning” – subtracting unit-specific means from both dependent and independent variables to isolate within-unit variation. While powerful, this and related centering approaches have pitfalls: they preclude estimation of time-invariant predictor effects, and coefficients reflect purely within-unit changes, which may differ from between-unit or overall effects. Such methods focus analysis on within-unit variation, potentially overlooking broader patterns if this variation is minimal, and can complicate the interpretation of interaction terms. Centering techniques can also be missapplied, for example by only being applied to the dependent variable or by dividing by instead of subtracting the group level mean. Consequently, the choice of centering technique fundamentally shapes the questions being addressed and the interpretation of results.

sales_demo_data
<xarray.Dataset> Size: 76kB
Dimensions:      (store_id: 20, time_period: 156, product_id: 1)
Coordinates:
  * store_id     (store_id) int64 160B 1 2 3 4 5 6 7 8 ... 14 15 16 17 18 19 20
  * time_period  (time_period) int64 1kB 1 2 3 4 5 6 ... 151 152 153 154 155 156
  * product_id   (product_id) int64 8B 1
Data variables:
    sales        (store_id, time_period, product_id) float64 25kB 2.2 ... 10.04
    covariate_1  (store_id, time_period, product_id) float64 25kB 0.4296 ... ...
    covariate_2  (store_id, time_period, product_id) float64 25kB 0.6666 ... ...
Attributes:
    betas:                       [-0.01237172  0.07431322]
    seasonality_amplitude:       0.22150897038028766
    trend_slope:                 0.005464504127199977
    store_effects:               [-0.44475205  0.12756087  0.11161652  0.4042...
    base_log_sales_per_product:  [1.24908024]
time_index = sales_normed.time_period.values.astype(int)

seasonal_control = np.sin(2 * np.pi * time_index / 52)
trend = time_index/52

# Fit a linear regression model
sales_df = sales_demo_data.to_dataframe().reset_index()
control_df = pd.DataFrame({
    'seasonal_control': seasonal_control,
    'trend': trend,
    'time_period': time_index
})
control_df['time_period'] = control_df['time_period']

total_df = sales_df.merge(control_df, on='time_period',  how='left')

train_df = total_df[total_df['time_period'] < 104].copy().set_index(['store_id', 'time_period'])
test_df = total_df[total_df['time_period'] >= 104].copy().set_index(['store_id', 'time_period'])

# Creat the dependent variable and independent variables
X_train = sm.add_constant(train_df[['seasonal_control', 'trend', 'covariate_1', 'covariate_2']])
y_train = np.log(train_df['sales'])
y_train_div = y_train/y_train.groupby('store_id').mean()
y_train_sub = y_train-y_train.groupby('store_id').mean()

# Fit the regression model
ME_model_standard = lm.RandomEffects(y_train, X_train)
ME_model_div = lm.RandomEffects(y_train_div, X_train)
ME_model_sub = lm.RandomEffects(y_train_sub, X_train)

# Fit the model
fitted_model_standard = ME_model_standard.fit()
fitted_model_div = ME_model_div.fit()
fitted_model_sub = ME_model_sub.fit()
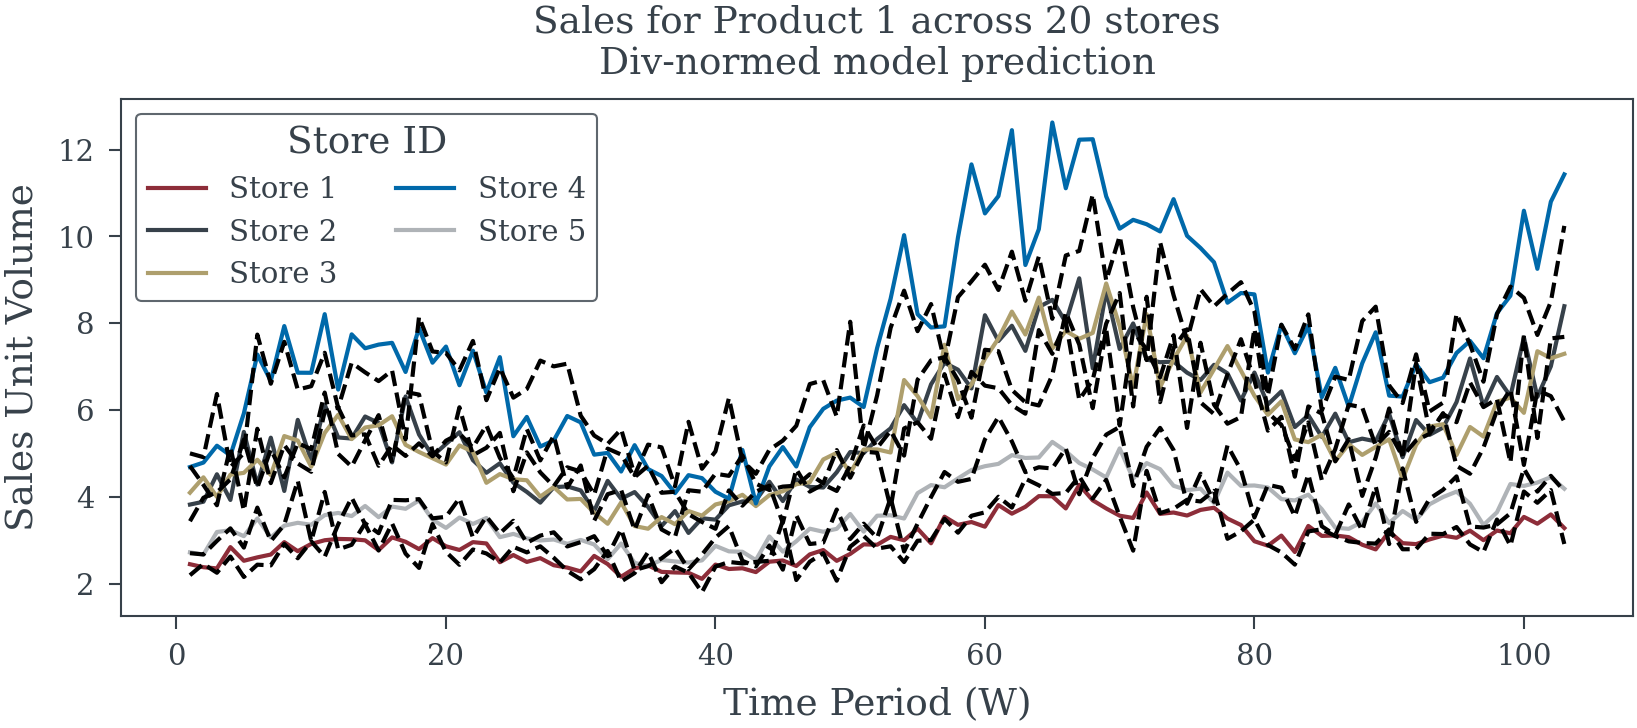
Figure 1: Sales model fitted with div-normed dependent variable
fitted_model_div.summary
RandomEffects Estimation Summary
Dep. Variable: sales R-squared: 0.6325
Estimator: RandomEffects R-squared (Between): -8.194e+27
No. Observations: 2060 R-squared (Within): 0.6335
Date: Wed, May 21 2025 R-squared (Overall): 0.6325
Time: 21:57:24 Log-likelihood 1544.7
Cov. Estimator: Unadjusted
F-statistic: 884.29
Entities: 20 P-value 0.0000
Avg Obs: 103.00 Distribution: F(4,2055)
Min Obs: 103.00
Max Obs: 103.00 F-statistic (robust): 884.29
P-value 0.0000
Time periods: 103 Distribution: F(4,2055)
Avg Obs: 20.000
Min Obs: 20.000
Max Obs: 20.000
Parameter Estimates
Parameter Std. Err. T-stat P-value Lower CI Upper CI
const 0.7644 0.0054 140.36 0.0000 0.7538 0.7751
seasonal_control 0.1838 0.0039 47.554 0.0000 0.1762 0.1913
trend 0.2288 0.0048 47.656 0.0000 0.2194 0.2383
covariate_1 -0.0085 0.0103 -0.8255 0.4092 -0.0286 0.0117
covariate_2 0.0517 0.0103 5.0180 0.0000 0.0315 0.0719
(sales_demo_data.attrs['betas'][None,:]/y_train.groupby('store_id').mean().values.flatten()[:, None]).mean(axis=0)
array([-0.00995315,  0.05978558])
fitted_model_div.variance_decomposition
Effects                   0.000000
Residual                  0.013185
Percent due to Effects    0.000000
Name: Variance Decomposition, dtype: float64
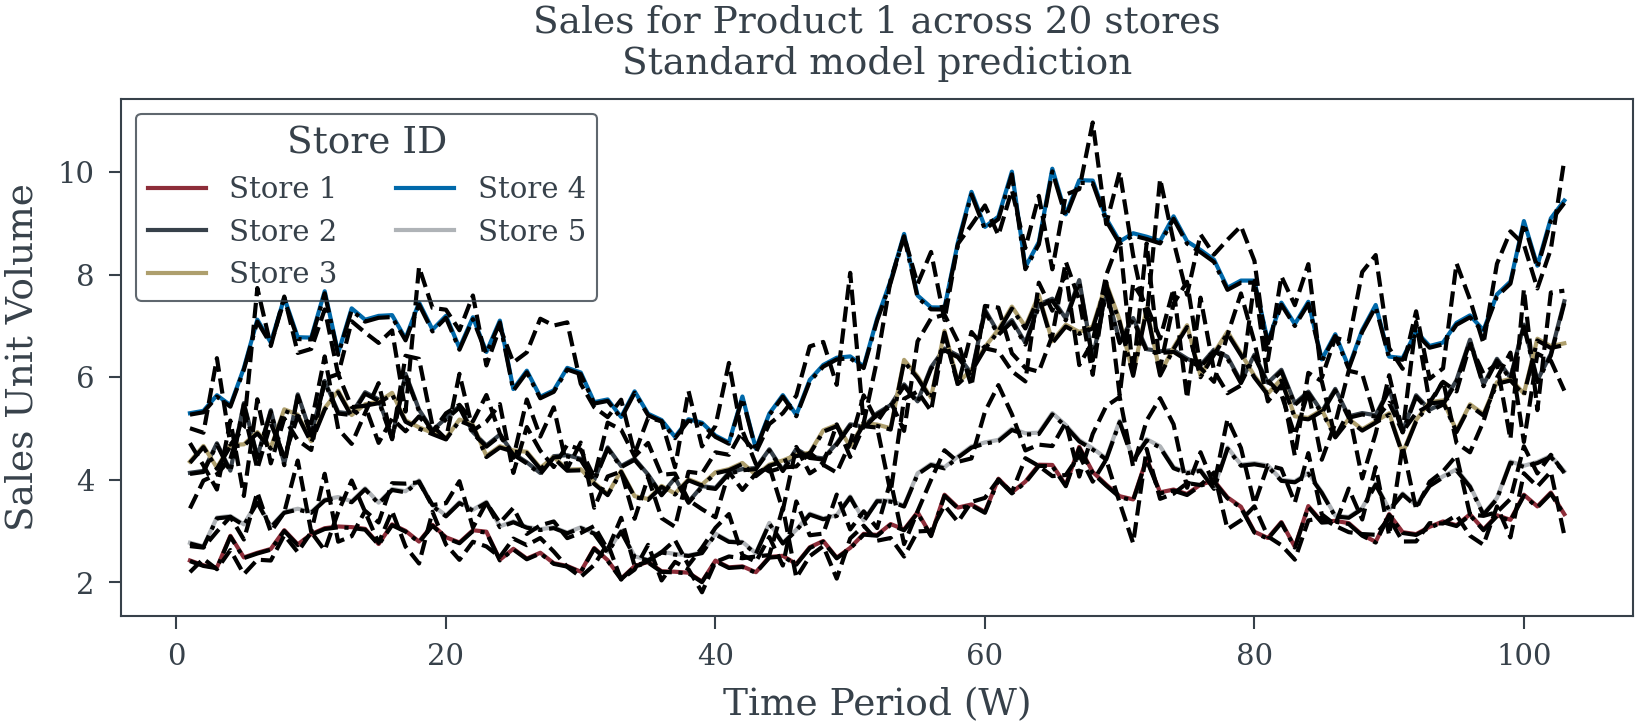
Figure 2: Sales model fitted with non-normed dependent variable
fitted_model_standard.summary
RandomEffects Estimation Summary
Dep. Variable: sales R-squared: 0.7741
Estimator: RandomEffects R-squared (Between): 0.0074
No. Observations: 2060 R-squared (Within): 0.7755
Date: Wed, May 21 2025 R-squared (Overall): 0.1414
Time: 21:57:24 Log-likelihood 1784.2
Cov. Estimator: Unadjusted
F-statistic: 1760.2
Entities: 20 P-value 0.0000
Avg Obs: 103.00 Distribution: F(4,2055)
Min Obs: 103.00
Max Obs: 103.00 F-statistic (robust): 1760.2
P-value 0.0000
Time periods: 103 Distribution: F(4,2055)
Avg Obs: 20.000
Min Obs: 20.000
Max Obs: 20.000
Parameter Estimates
Parameter Std. Err. T-stat P-value Lower CI Upper CI
const 1.1318 0.1150 9.8430 0.0000 0.9063 1.3573
seasonal_control 0.2284 0.0034 66.389 0.0000 0.2216 0.2351
trend 0.2850 0.0043 66.675 0.0000 0.2766 0.2934
covariate_1 -0.0165 0.0095 -1.7267 0.0844 -0.0352 0.0022
covariate_2 0.0764 0.0096 8.0036 0.0000 0.0577 0.0952
sales_demo_data.attrs['betas']
array([-0.01237172,  0.07431322])
fitted_model_standard.variance_decomposition
Effects                   0.264310
Residual                  0.010396
Percent due to Effects    0.962157
Name: Variance Decomposition, dtype: float64
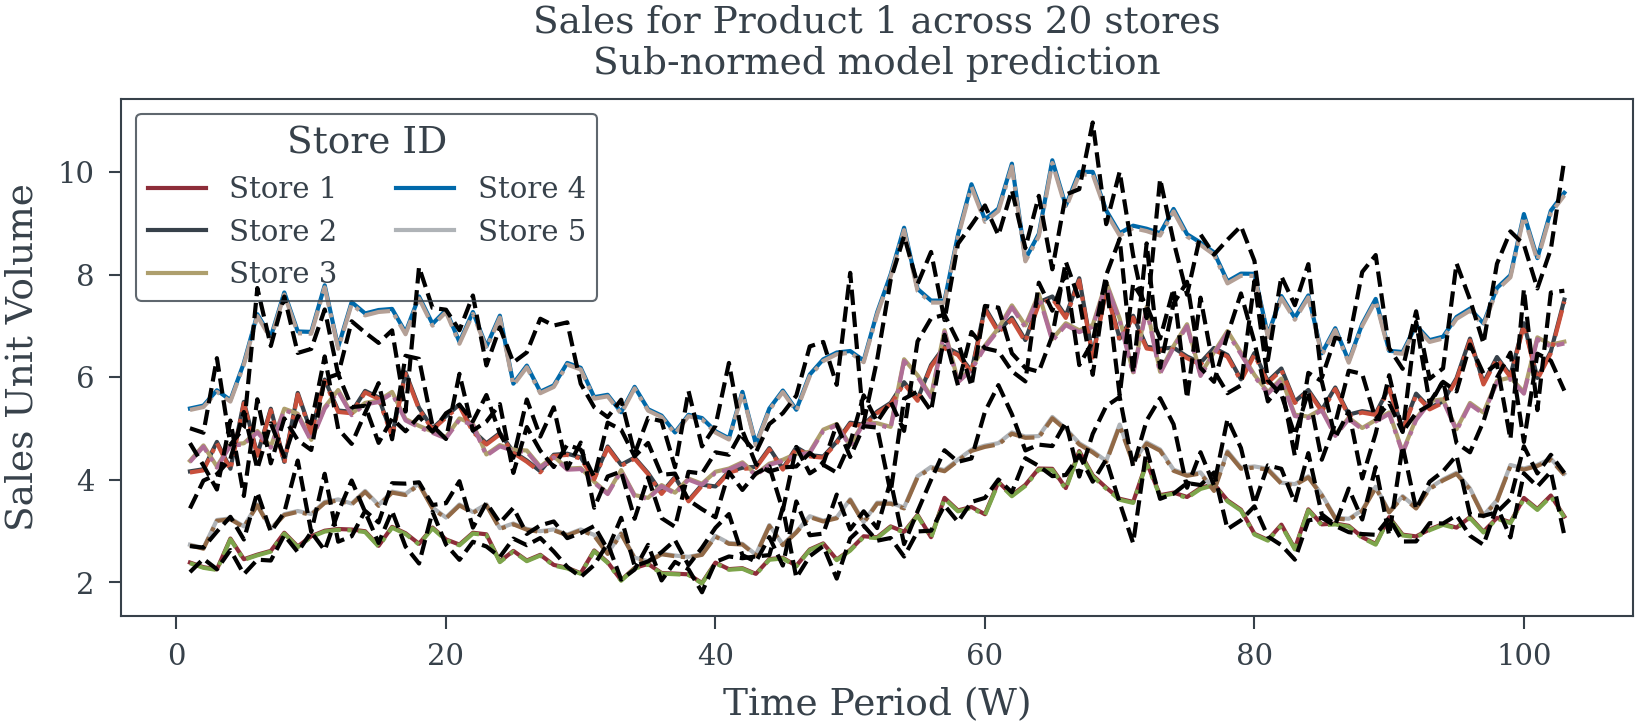
Figure 3: Sales model fitted with sub-normed dependent variable
fitted_model_sub.summary
RandomEffects Estimation Summary
Dep. Variable: sales R-squared: 0.7740
Estimator: RandomEffects R-squared (Between): -1.327e+28
No. Observations: 2060 R-squared (Within): 0.7754
Date: Wed, May 21 2025 R-squared (Overall): 0.7740
Time: 21:57:24 Log-likelihood 1785.6
Cov. Estimator: Unadjusted
F-statistic: 1759.1
Entities: 20 P-value 0.0000
Avg Obs: 103.00 Distribution: F(4,2055)
Min Obs: 103.00
Max Obs: 103.00 F-statistic (robust): 1759.1
P-value 0.0000
Time periods: 103 Distribution: F(4,2055)
Avg Obs: 20.000
Min Obs: 20.000
Max Obs: 20.000
Parameter Estimates
Parameter Std. Err. T-stat P-value Lower CI Upper CI
const -0.2942 0.0048 -60.719 0.0000 -0.3037 -0.2847
seasonal_control 0.2284 0.0034 66.429 0.0000 0.2216 0.2351
trend 0.2850 0.0043 66.710 0.0000 0.2766 0.2934
covariate_1 -0.0140 0.0091 -1.5283 0.1266 -0.0319 0.0040
covariate_2 0.0729 0.0092 7.9594 0.0000 0.0550 0.0909
sales_demo_data.attrs['betas']
array([-0.01237172,  0.07431322])
fitted_model_sub.variance_decomposition
Effects                   0.000000
Residual                  0.010396
Percent due to Effects    0.000000
Name: Variance Decomposition, dtype: float64
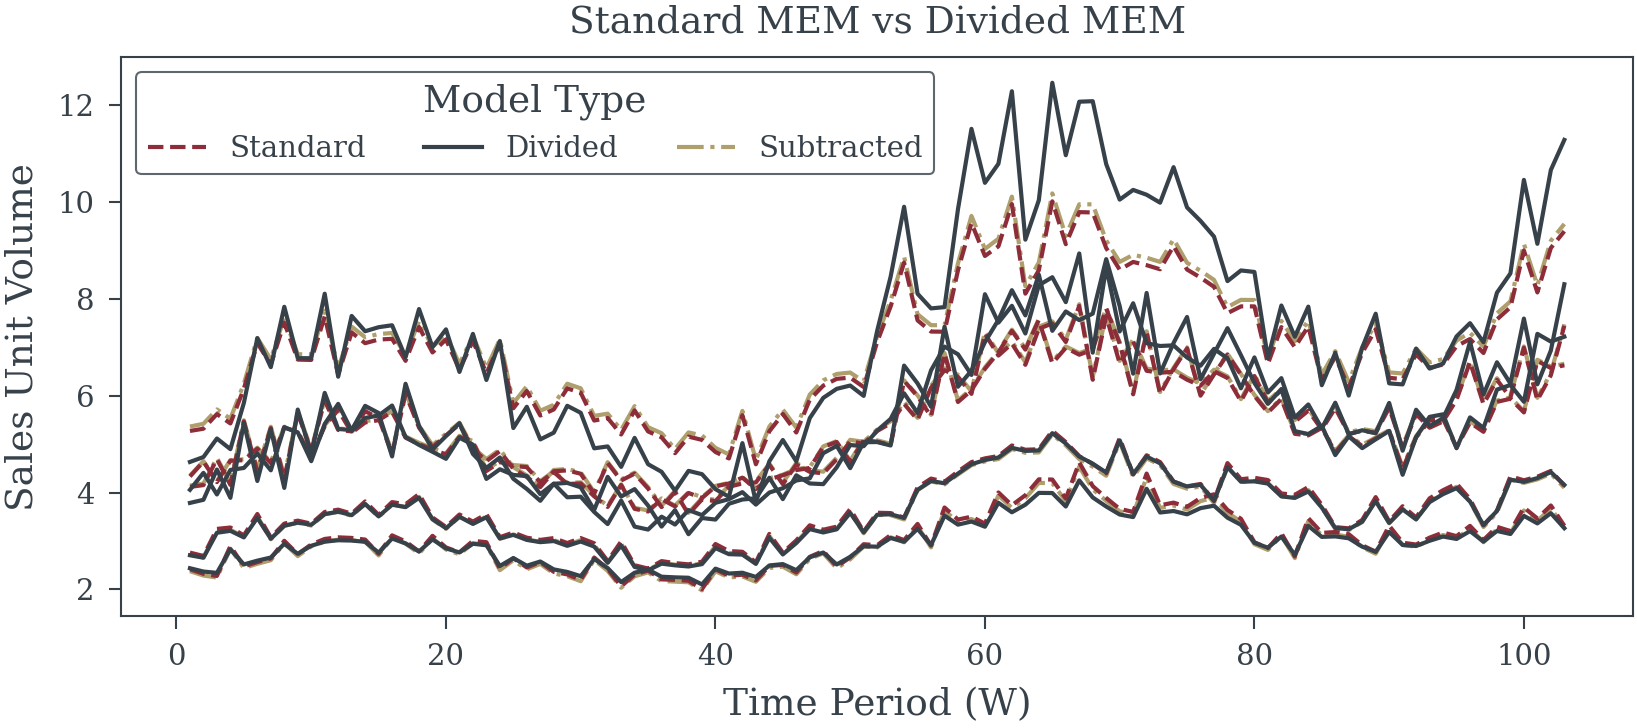
Figure 4: The divided MEM model and the standard MEM model produce much different prediction. Using the wrong model structure will produce biased predictions, and missleading results.

Reuse

Citation

BibTeX citation:
@online{reda,
  author = {Reda, Matthew},
  title = {Centering in {Panel} {Models}},
  url = {https://redam94.github.io/common_regression_issues/normalization_in_panel_models.html},
  langid = {en},
  abstract = {Panel regression models analyze data from the same units
    observed over multiple time periods, enabling control for
    time-invariant unobserved unit characteristics and estimation of
    within-unit effects. A common technique, particularly in
    fixed-effects models, involves “demeaning” – subtracting
    unit-specific means from both dependent and independent variables to
    isolate within-unit variation. While powerful, this and related
    centering approaches have pitfalls: they preclude estimation of
    time-invariant predictor effects, and coefficients reflect purely
    within-unit changes, which may differ from between-unit or overall
    effects. Such methods focus analysis on within-unit variation,
    potentially overlooking broader patterns if this variation is
    minimal, and can complicate the interpretation of interaction terms.
    Centering techniques can also be missapplied, for example by only
    being applied to the dependent variable or by dividing by instead of
    subtracting the group level mean. Consequently, the choice of
    centering technique fundamentally shapes the questions being
    addressed and the interpretation of results.}
}
For attribution, please cite this work as:
Reda, Matthew. n.d. “Centering in Panel Models.” https://redam94.github.io/common_regression_issues/normalization_in_panel_models.html.