Within days of an election a familiar reading appears: moderate Democrats beat their polls, candidates further to the left fell short of theirs, and ideology is the reason. I have heard it from many commentators, and I suspected it left out three things: how strong the opponent was, how much support the national party gave, and when the label was attached. “Moderate” and “progressive” are often assigned after the count, by people who have seen which candidates beat their polls.
So I tested the claim on the 184 House and Senate races of 2018 and 2022 that had a poll in the last 21 days and a certified result, with every label taken from a roster or an endorsement list dated before that election. The test could have come out either way. With dated labels there is no gap: the difference in mean poll error, centre-list nominees minus left-list nominees, is points (90% interval to ), and in the full model it is ( to ). Zero is well inside both intervals, so the data cannot tell which group did better. They do leave little room for a large centre advantage. Of my three suspicions, the notebook supports the third strongly, supports the first in part, and does not support the second as a driver of poll error.
Poll error is a narrower claim than winning votes
The claim is about poll error, the gap between a result and the final polls. There is good evidence that ideologically extreme nominees win fewer votes (Canes-Wrone, Brady and Cogan 2002; Hall 2015). But a penalty that voters apply is a penalty that pollsters can measure: if a nominee is too far from a district, the polls should already say so. For ideology to move a candidate off the polls, something about that candidate’s support has to stay invisible to pollsters until the votes are counted.
For race the outcome is
both as Democratic minus Republican, in points, so a positive means the Democrat beat the polls. The final poll average is the plain mean of the polls whose fieldwork ended in the last 21 days. That gives 122 races in 2018 and 62 in 2022, and 94 of the 184 rest on a single poll.
Buckets fixed before the election
The test needs groups that existed before the votes were counted. Each list in the notebook is a Wikipedia revision or an Internet Archive capture with a timestamp before that cycle’s election day, and nobody is classified by judgment. A nominee is on a left list when named by the Congressional Progressive Caucus roster or by the endorsement lists of Justice Democrats, Our Revolution or Brand New Congress. A nominee is on a centre list when named by the New Democrat Coalition or Blue Dog Coalition rosters, the Blue Dog PAC’s endorsements or the NewDem Action Fund’s lists.
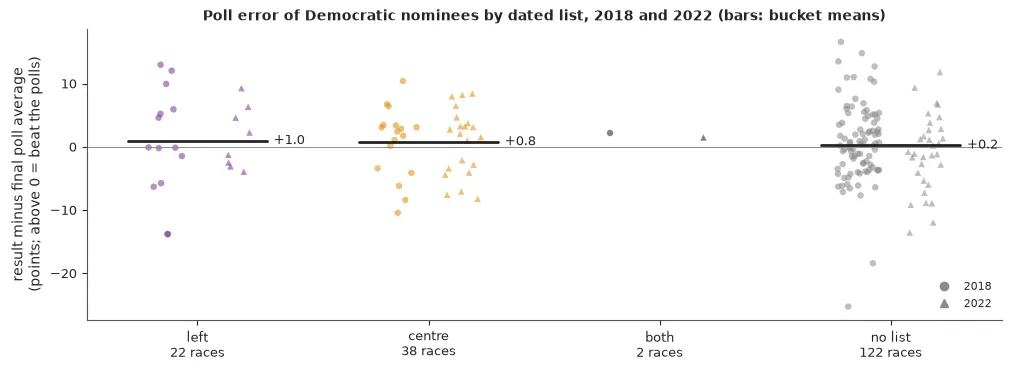
Of the 184 Democratic nominees, 22 are on a left list only, 38 on a centre list only, 2 on both and 122 on none. This is the thin part of the analysis: 14 of the 22 ran in 2018 and 19 ran in House races. The third group in the claim, DSA candidates, is empty. Wikipedia’s list of DSA officeholders can be dated for 2022 and 2026, and it names no Democratic nominee in these races.
The comparison a commentator makes
In its simplest form the claim is a difference of two means. Left-list nominees beat their final polls by 0.95 points on average and centre-list nominees by 0.77. The difference is , and neither cycle shows a gap alone ( in 2018, in 2022). Single races are spread around those means with standard deviations of 5.3 to 7.3 points.
A difference in means ignores that sponsored polls lean, that a race with one poll is noisier than a race with ten, that all the polls of a year can miss together, and that the buckets differ in district, opponent and party support. The model carries each of these:
Here is the polling error shared by a cycle, lets House and Senate polls miss differently, is the lean of sponsored polls, and mark the two buckets, holds lean, incumbency and the opponent, holds party support, and is shared by the races of a state in one year. The noise shrinks with the number of polls in the average. The shared error matters most: a year in which every Democrat beats the polls is a year in which the moderates do too. The quantity of interest is the contrast, and the claim says it is positive:
b = pm.Normal("b", 0, 3.2, dims="cycle")  # shared error; scale from 1998-2016
theta = pm.Normal("theta", 0, 3.0, dims="bucket")  # left list, centre list
pm.Deterministic("contrast", theta[1] - theta[0])  # centre minus left
The fit has no divergences and a largest of 1.006. The contrast is , with a 90% interval from to .
The interval says two things. The data cannot tell which bucket did better. And they speak against a large advantage for the centre: the probability that centre-list nominees beat their polls by 2 points or more than left-list nominees is 0.015, against 0.225 for the reverse.
The opponent and the party
My first two suspicions were about what the comparison leaves out, and the buckets do differ in more than their lists. Left-list nominees ran in places 4.6 points more Democratic on average, and they had less party support: 18% were in the DCCC’s Red to Blue programme against 50% of centre-list nominees, and the Hill committees spent $0.64M on the average left-list race against $1.22M on the average centre-list race.
The opponent matters, through incumbency. Against a Republican who holds the seat, the Democrat beat the polls by 1.99 points (0.38 to 3.57). That is the only opponent measure whose interval excludes zero. The others (prior service in Congress, receipts, and a dated listing in the House Freedom Caucus or the Republican Main Street Partnership) point nowhere firm. All of them are proxies for the kind of race the Democrat was in. Nothing in these data measures whether voters liked the opponent, so the first suspicion is supported only in the form the data can express.
Party support is the surprise. The sixteen measures (receipts, Red to Blue, the party committees’ direct spending, and independent expenditures by spender, side and purpose) share a scale of 0.19 (0.03 to 0.43), and no coefficient is distinguishable from zero. The parties did treat the buckets differently. But where the money went says almost nothing about who beat their polls once lean and incumbency are known, so my second suspicion is not supported as a driver of poll error.
Conditioning on money needs care. Committees spend where a race looks close, and their choices may respond to the nominee, which would make the money a consequence of the thing being tested. The full model therefore answers a narrow question: among nominees the parties treated alike, do the lists still predict poll error? Without the party block the contrast is ( to ), and no step in the figure produces the gap the claim describes.
The terms that carry weight are elsewhere. Sponsored polls lean 4.99 points (3.24 to 6.84) towards their sponsor. For every 10 points of partisan lean towards the Democrats, the Democrat beats the polls by a further 1.85 points (1.31 to 2.39), so polls understate the stronger party in lopsided places.
Every reasonable definition
A bucket is a choice, and so far each choice was made once. The notebook refits the model under 25 specifications: other sets of lists, nominees who do not hold the seat, House races, each cycle alone, poll windows of 42 and 70 days, unsponsored polls, DW-NOMINATE as a continuous score, and four variants of the model.
The medians run from to , with 9 above zero and 16 below, and no 90% interval excludes zero. The sign follows the choices in a readable way. Endorsement lists give a negative contrast in every sample. Caucus rosters in House races give ( to ), on 8 and 13 nominees. An analyst who is free to choose can report either sign, and “caucus members in House races” would be a reasonable-sounding choice that gives the commentators’ direction. What no choice gives is an interval that excludes zero.
Labels given after the result
The multiverse held one thing fixed: every label was dated before the election. Commentary is not bound by that.
Even a formal score moves. DW-NOMINATE is re-estimated as members cast more votes. Between a copy of Voteview’s file captured on 5 May 2022 and today’s file, the scores of the 403 nominees of 2022 correlate at 0.997, and 48 of them still moved by more than 0.05, on a scale where the two bucket means are 0.15 apart. A score looked up after an election is not the score that existed before it.
Now the cruder mechanism. Of the 184 nominees, 124 are open to labelling: 122 on no list and 2 on both. Suppose a share of them is given a bucket after the count, by the rule that makes the story: a nominee who beat the polls is called a moderate, and one who fell short is called a progressive. Nobody labels this mechanically, but any tendency in that direction works the same way, more slowly.
The dated labels give . Relabel 12 of the 124 and the difference in means is (0.8 to 2.2). Relabel 25 and it is . The model does not protect against this: on relabelled buckets its contrast is at a tenth and (1.7 to 4.9) at a half. No covariate can adjust away a label that was built from the outcome.
The right panel repeats the exercise in 400 simulated pairs of elections, drawn from the fitted model with both list effects set to zero. With dated labels the difference in means there has a standard deviation of 1.5 points, so buckets of 22 and 38 show a gap of 2 points or more, in one direction or the other, in 20% of worlds. With 12 relabelled the median gap is and it exceeds in 44% of worlds. With 25 it is and exceeds in 83%. An apparent ideology effect of 2 to 3 points needs no ideology. In these data it needs a dozen or two of 184 nominees to be described after the count. This is the suspicion the notebook supports most strongly.
2026, provisionally
The claim is being made again about 2026, and 2026 cannot yet be analysed properly. Nothing is certified. The notebook holds provisional counts read from Wikipedia’s state and race articles as they stood between 6 and 11 November, for 30 of the 97 polled House races and 21 of the 24 polled Senate races. The polled races of eleven states have no count at all, and the source does not say what share of the expected vote is in.
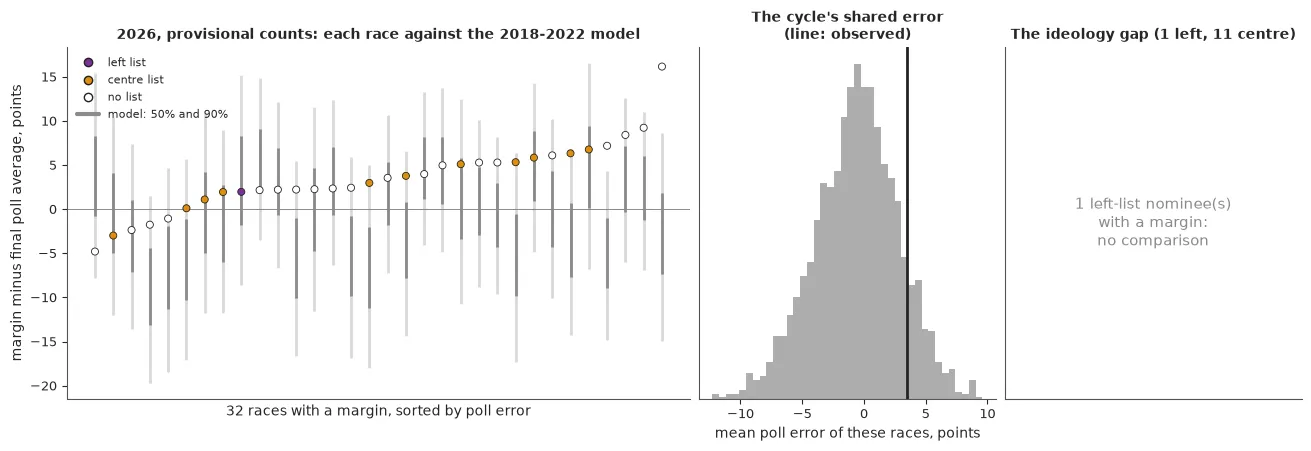
Of the 61 races of 2026 with a final poll, 32 have a provisional count, and among those 32 there is one left-list nominee, against 11 on a centre list and 20 on none. Certification will not repair this, because the 61 hold one left-list nominee in all. On dated lists and final polls there is no bucket comparison to make.
What the provisional counts can show is the shared error. In the 32 races the Democrats run 3.5 points ahead of their final polls on average. The model fitted to 2018 and 2022 expected , with a 90% range from to , and gives a mean this high a probability of 0.11. The gap is not confined to a bucket: centre-list nominees with a count are 3.3 points ahead of their polls and no-list nominees 3.7. In a year like this, “moderates beat their polls” is true of the counts so far and says nothing about moderates.
What to do in practice
- Date the labels. Write down who is in which group, and the source, before the count. A label assigned afterwards can carry the outcome inside it.
- Say which outcome you mean. Poll error is not vote share. A penalty the polls already measured is not a poll error.
- Model the shared error first. When a whole cycle runs ahead of its polls, every group in it does.
- Show every reasonable definition. If the sign changes with the definition, report that.
- Simulate the claim with no effect in it. The gap that noise and relabelling produce on their own is the bar a real effect has to clear.
In these two cycles, with labels fixed in advance, the commentators’ pattern does not appear, and the intervals leave room for a small effect in either direction. What the data do show is how little relabelling it takes to produce the pattern.
Source: my worked example Did ideology move candidates off their polls? Opponents, party money and labels given after the fact, which cites Canes-Wrone, Brady and Cogan (2002) and Hall (2015) on ideology and votes, Gelman and Loken (2013) on forking paths, and Steegen, Tuerlinckx, Gelman and Vanpaemel (2016) on the multiverse. Every number here is a printed output of that notebook, a prior written in its source, or a count or difference taken from its outputs. The 2018 and 2022 margins are certified. The 2026 numbers are provisional counts read from Wikipedia revisions dated 6 to 11 November 2026 and retrieved on 11 November 2026: uncertified, incomplete, missing the polled races of eleven states, and not results.