On the afternoon of 3 November I froze a forecast of the 2026 US midterms before any polls closed: 236 Democratic House seats (90% interval 217 to 262) with a 0.94 chance of a majority, and 52 Democratic-caucus Senate seats (48 to 56, counting the 34 seats not on the ballot) with a 0.78 chance of control. Then the calls started. I logged them by hand through the night and the next day, and reran the forecast after each batch.
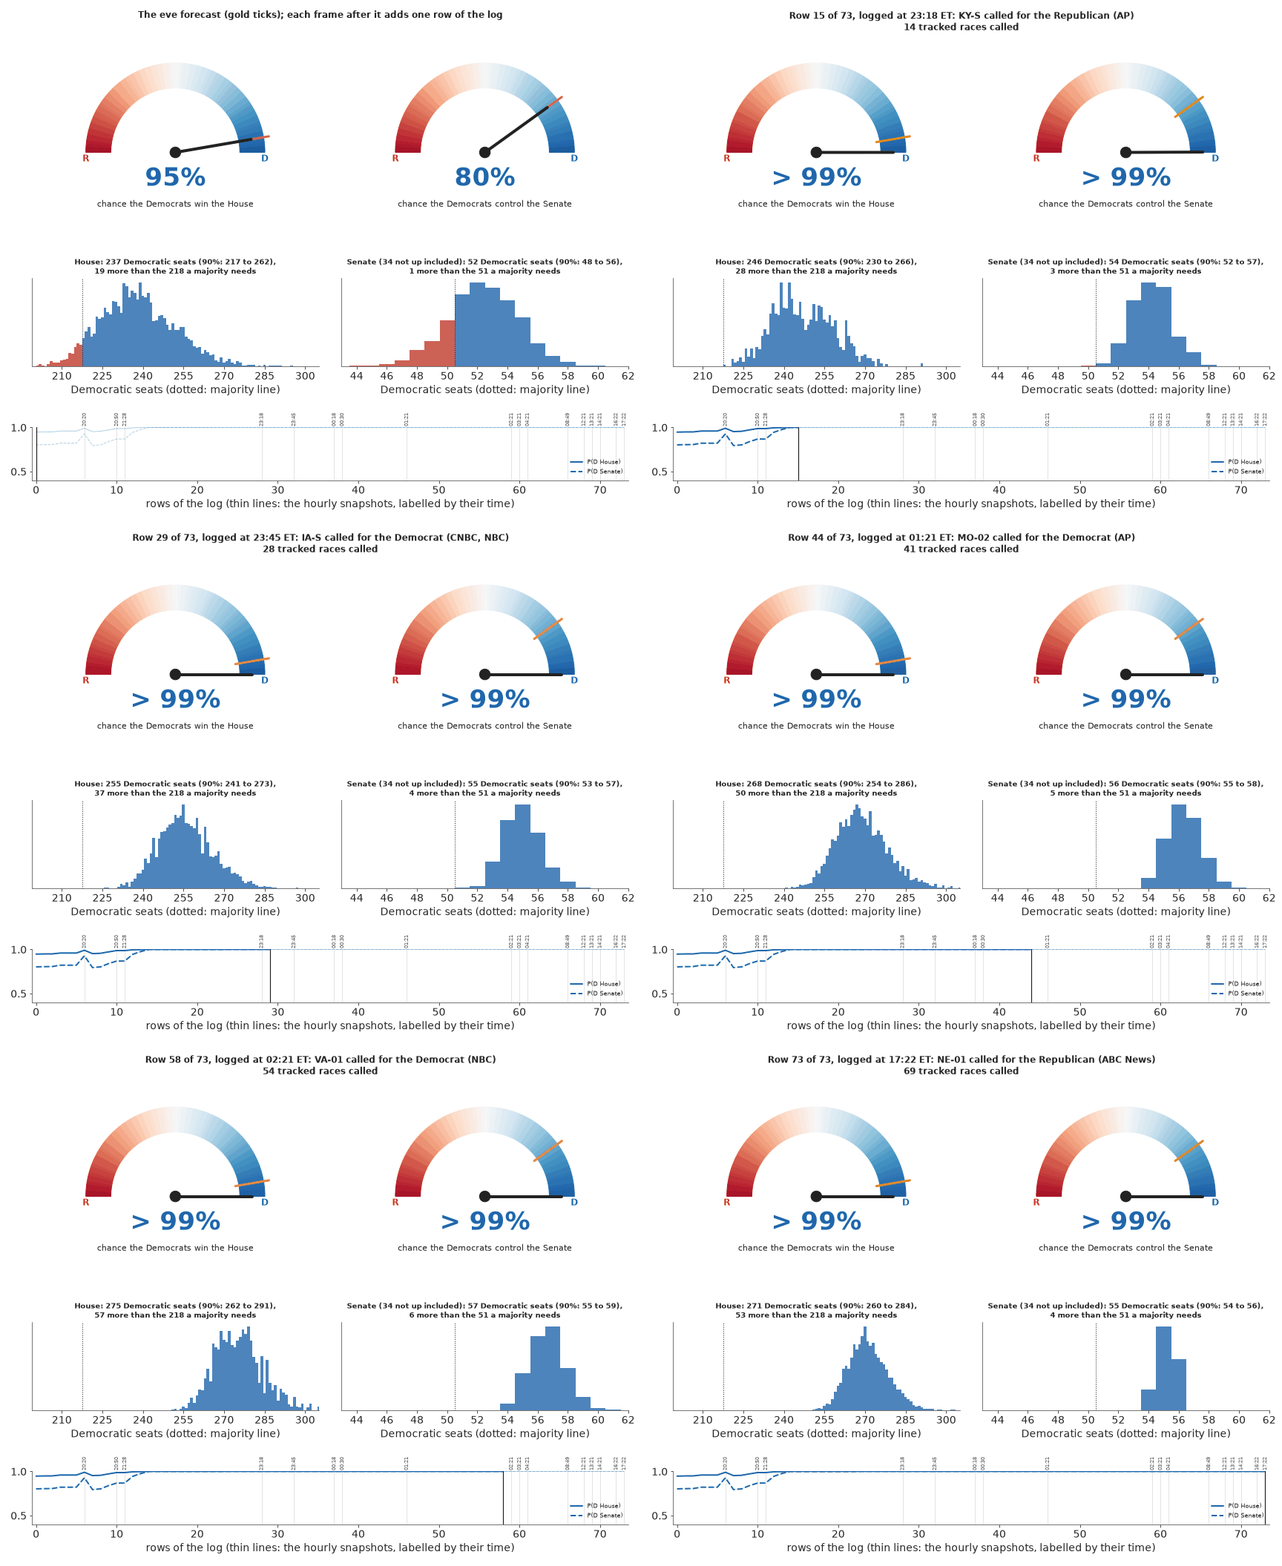
Two lessons came out of it that are not about elections. A race call is weak evidence about its own race and can be strong evidence about every other race, because the races share a national environment and a polling error. And the cheap way to update a posterior, reweighting the draws you already have, fails exactly when the news is big. By the notebook’s last snapshot, at 17:22 ET on 4 November with 69 tracked races called and one too close to call, the refitted model put both chambers above 0.99 for the Democrats, with 271 House seats (260 to 284) and 55 Senate seats (54 to 56). Those numbers are the model’s reading of projections by the AP and the networks as of that snapshot. Counting and calls went on afterwards, and nothing in this post is a certified result.
The forecast that was frozen
The frozen model combines generic-ballot polls, race polls where they exist and fundamentals everywhere else. What matters on the night is its error structure. A race’s margin is built from a national margin, a state effect shared by the House and Senate races in that state, and the race’s own noise, and every poll that informs those pieces carries one shared polling error:
Here collects the shared pieces and the race’s fundamentals, and is the race-level spread for its office. The frozen file held only summaries, so the notebook rebuilds the posterior from the same code, seed and hashed inputs: 4,000 draws of 451 modelled races, 104 of them with polls. The rebuild matches the frozen file to within sampling noise, and the replay below starts from its values of 0.946 for the House and 0.801 for the Senate.
A call is an interval, not a margin
When the AP calls a race for the Democrat it does not report a margin. It reports that the margin is on one side of zero, often with most of the vote uncounted. So the likelihood of a call is the probability of that half-line, with the race’s own noise integrated out:
The points softens the edge, because calls are occasionally wrong.
How much a call says depends on how expected it was. Georgia’s Senate race was the first call in the log. The frozen forecast gave the Democrat a 0.994 chance and a median margin of D+14, so the call removed a sliver of the distribution: the House chance went from 0.946 to 0.948, the Senate chance from 0.801 to 0.804, and no other Senate race moved by more than 0.002. Iowa’s Senate race, at 0.566, lost almost half of its distribution to the same kind of call. The natural measure is the surprise, : 0.007 nats for Georgia and 0.569 for Iowa.
Silence is an interval too. A race listed as too close to call is read as points, which is an assumption (the notebook also tries 1.5 and 5). At 20:20 ET Florida’s Senate race was listed that way, in a state where the forecast had the Republican ahead by about five points. That one silence lifted the Senate chance from 0.82 to 0.93, more than all the calls in that snapshot together. Half an hour later Florida was called for the Republican, and that single row took the Senate chance from 0.926 to 0.793, the largest single-row move of the night.
Reweight or refit
There are two ways to apply the calls. The fast one keeps the frozen draws and weights each by the likelihood of everything called so far:
import numpy as np
from scipy.stats import norm

TAU = 0.5  # points: the soft edge on a call


def call_loglik(mu, sd, winner):
    """log P(call | draw); mu and sd hold one race's value in every draw."""
    sign = 1.0 if winner == "D" else -1.0
    return norm.logcdf(sign * mu / np.sqrt(sd**2 + TAU**2))


logw = sum(call_loglik(mu[:, i], sd[:, i], winner) for i, winner in called)
w = np.exp(logw - logw.max())
w /= w.sum()
ess = 1.0 / np.sum(w**2)
This is exact importance sampling and it is instant. Its weakness is the sample. After the Georgia call the weighted draws were worth 3,987 of the 4,000. Had Georgia gone the other way they would have been worth 16, and every number computed from them would rest on the handful of draws in which that upset happened. Surprising results are the ones most worth updating on, and they are the ones reweighting cannot carry.
The night shows the decay. The effective sample size was 1,131 after the first batch, 302 at 23:18 ET, 30 at 01:21 and 2 by the last snapshot, where the reweighted House interval had shrunk to 272 to 274 seats. The alternative adds the same likelihood terms to the model as a potential and samples again, which takes about half a minute:
with model:  # the frozen model, unchanged
    terms = [
        pm.logcdf(pm.Normal.dist(0, 1), sign * mu_r / pt.sqrt(sd_r**2 + TAU**2))
        for mu_r, sd_r, sign in called  # sign: +1 called D, -1 called R
    ]
    pm.Potential("night", pt.sum(pt.stack(terms)))
    idata = pm.sample(target_accept=0.9)
At the last snapshot the refit gave 270 House seats (259 to 282) on the calls alone, and 271 (260 to 284) once the three races counted past 95% entered as margins. The race chances from the two methods differed by 0.022 on average and by 0.707 in the worst race.
The notebook also renders the night one logged row at a time, refitting whenever the effective sample size drops below 500:
How one call moves the others
The seats a call settles directly are the small part of the update. In the replay both chambers reach 1.000 at 23:18 ET, after a batch that included Democratic calls in the Ohio, Texas and South Carolina Senate races (frozen chances 0.65, 0.77 and 0.39). What moved was the shared polling error. On the eve its posterior was points (90% interval to ), where positive means the polls were too Democratic. In the last refit it was ( to ), and the national House margin had gone from D+8.0 (3.2 to 12.8) to D+13.9 (11.7 to 16.2). The model’s reading of the night is that the polls understated the Democrats by about five points, and that shift applies to every race, called or not.
The clearest evidence is in districts nobody had called. The notebook lists the uncalled races that moved most at its last update, and all twelve are House districts whose chances had risen since the eve on other races’ calls alone: NJ-02 from 0.07 to 0.30, KS-02 from 0.06 to 0.34, CO-05 from 0.36 to 0.81.
What was still out
At the last snapshot the model still had 87 races between 0.05 and 0.95. Two were Senate races: Alaska at 0.78, which never appears in the call log, and Mississippi at 0.43, listed as too close with the count tied at 48.9 each and 97.2% of the expected vote in. None of the 87 could change control in the model. The chance of each chamber was 1.00 whichever way any single race went, so the notebook’s what-to-watch table and its leave-one-call-out table are both flat. Those races decide only the size of the majorities.
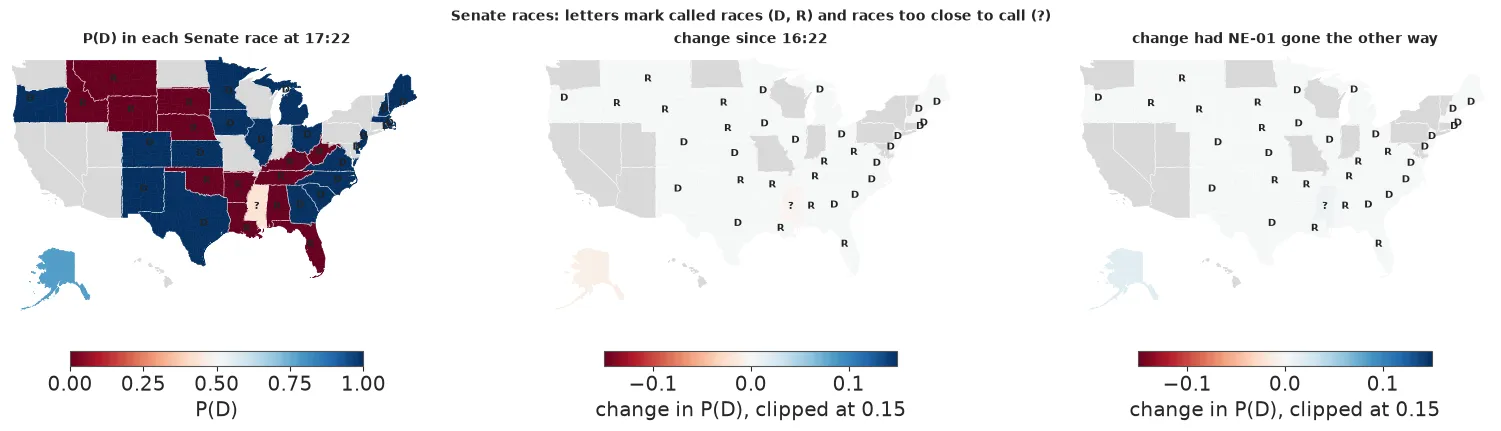
The log tracks Senate races and, in the House, only the districts the forecast had between 0.05 and 0.95. So the notebook prints no count of seats actually called and no final totals, and I am not going to supply them from anywhere else.
How the forecast is scoring so far
The scorer written alongside the frozen forecast needs final margins. In the published notebook it still prints “2026 election results: not yet available. Both frozen forecasts wait to be scored.” The call log supports only a partial check.
Of the 69 calls, 57 went to the side the forecast favoured. All 12 that did not were called for the Democrat in a race the forecast leaned Republican, led by IN-05 (0.18), OH-15 (0.20) and TX-23 (0.26). None of the 14 Republican calls went against the forecast’s lean. Misses that all point the same way are one error counted twelve times, and it is the shared polling error again.
Size is where the forecast looks weakest. The refit’s median of 271 House seats is above the frozen 90% interval’s upper end of 262, and its national margin of D+13.9 is above the frozen interval’s upper end of 12.9. The Senate median of 55 is inside 48 to 56. These are model estimates given the calls, not counts. If the final numbers land near them, the forecast will have had both chambers right and the House total outside its interval. The same model put the Democrats a few seats short in its 2018 and 2022 backtests, and the stress test I added on election day asked what happens if the polls overstate the Democrats. The night’s evidence points at the other tail.
What to do in practice
- Freeze draws, not summaries. A frozen posterior is the prior for whatever arrives next. I froze quantiles and had to rebuild the draws from the code, the seed and hashed inputs. Save the draws.
- Write the likelihood of the report you actually receive. A call is a half-line and a “too close” is an interval. A running count becomes a margin only when it is nearly complete, because the order in which ballots are counted differs by state. The notebook waits for 95% and widens the standard deviation with the share still out.
- Reweight for quick questions, refit for answers. Track the effective sample size next to every reweighted number. Below a few hundred, stop and sample.
- Model the shared errors explicitly. They are the channel through which one observation informs the rest. With independent race errors, 69 calls would have said nothing about the districts still out.
- Treat silence as an assumption. An uncalled race is evidence, but how much depends on a threshold you chose. Report the result under several.
- Write the scorer before the results exist. Then run it once, on final numbers, whatever they turn out to be.
An election night is a posterior being updated in public, one interval at a time. The method is the same for any forecast that meets its outcomes in pieces: a sales plan as regions report, a launch as markets open.
Source: my worked examples Election night: how each call reshapes the 2026 forecast and Ragged information: polls, fundamentals and money in the US midterms, which cites Linzer (2013) and Heidemanns, Gelman and Morris (2020) for combining polls with fundamentals. Every election number here is a printed output of those notebooks, a row of the call log, or a count or difference taken from them, as of the snapshot at 17:22 ET on 4 November 2026: 73 rows, 69 tracked races called, one too close to call. Calls are projections by the AP and the networks, entered by hand, not certified results, and counting continued after the snapshot.