Guided mode for analysts · exact control for data scientists · honest uncertainty · one safe platform
Trustworthy models,
from spreadsheet to endpoint.
modeling-api fits Bayesian and classical models of data that has named dimensions (market × channel × week, store × product × day, household × trip). It also fits science models of images, fields, maps and graphs, causal models that measure the effect of a change, and neural networks for tables and images. The models answer questions in the units that your business uses. An analyst uploads a spreadsheet and gets a report, a sanity scorecard and instant what-if sliders. A data scientist writes a small spec or some lines of Python and gets the same model behind a versioned endpoint. Each call uses the same fitted preprocessing again, exactly.
Full analyses (tests, decisions, models and benchmarks) run as versioned workflows. A model goes live only after it is better than shuffled data, fake drivers and a naive forecast. Each run occurs in a new sandbox, and each result tells how sure it is. Each run also keeps its metrics, params, tags and images, so that you can compare runs side by side.
Your first MMM in Guided mode Quickstart for data scientists What's new in 0.15

v0.15: deep learning and image collections
The new package mapi-jax trains neural networks for tables and images on JAX and
Flax: dl.mlp, dl.cnn_classifier and dl.finetune_classifier. The training shows its
curves while it runs, logs images of the predictions, stops early, saves checkpoints and
gives draws. Image collections hold up to 1 000 000 images. The client uploads only
the new images, and an upload that stops can continue. The resource class GPU
gives a run one NVIDIA L4.
Since 0.9
- v0.14: run comparison, experiments and saved views. Runs log images, figures and tables. Image datasets and a classification pack (Compare runs, Image data).
- v0.13: causal models (
causal.impact,causal.synthetic_control,causal.did) and a Bayesian structural time series,ts.bsts(Measure the effect of a change). - v0.12: the MMM pack:
mmm.nested,mmm.multivariate, channel effects that change over time, counts and shares, and ten new plot recipes (Marketing-mix models). - v0.11: run tracking. Each run keeps its metrics, params, tags, notes and log lines (Track metrics, params and tags).
- v0.10: score plots by the shape of each output, and standard plots and metrics for classifiers, state models and ADVI fits.
- v0.9: the science gallery: 15 science models, 14 plot recipes and Bayesian workflow nodes (What's new in 0.9).
From 0.5 to 0.8
- v0.6: a spec builder. The YAML editor completes names, and a Visual view shows the same spec as blocks (Build).
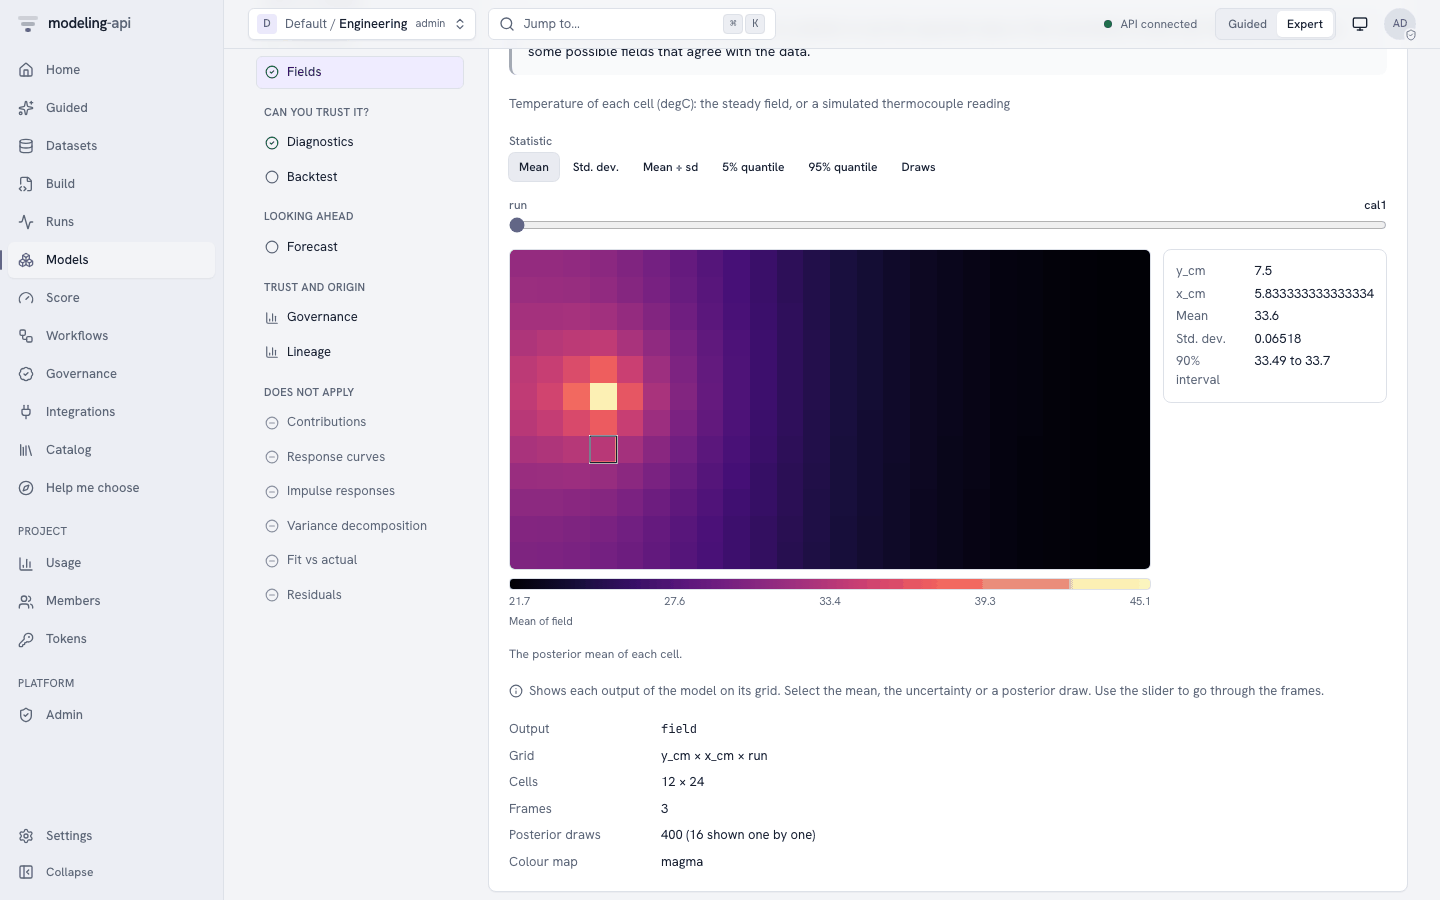
- v0.7: the first four science models. An output can be a 2-D field, and the Model Explorer shows it with its uncertainty.
- v0.8: tree datasets. A NetCDF-4 or HDF5 file keeps its groups, and a version can combine many files (Tree datasets).
- v0.5: workflows, governance with null tests, Data and Model Explorers, mmm-framework and twelve statsmodels models (What's new in 0.5).
Two ways in, one model
Analysts
Upload → report → scenario in minutes, with honest uncertainty.
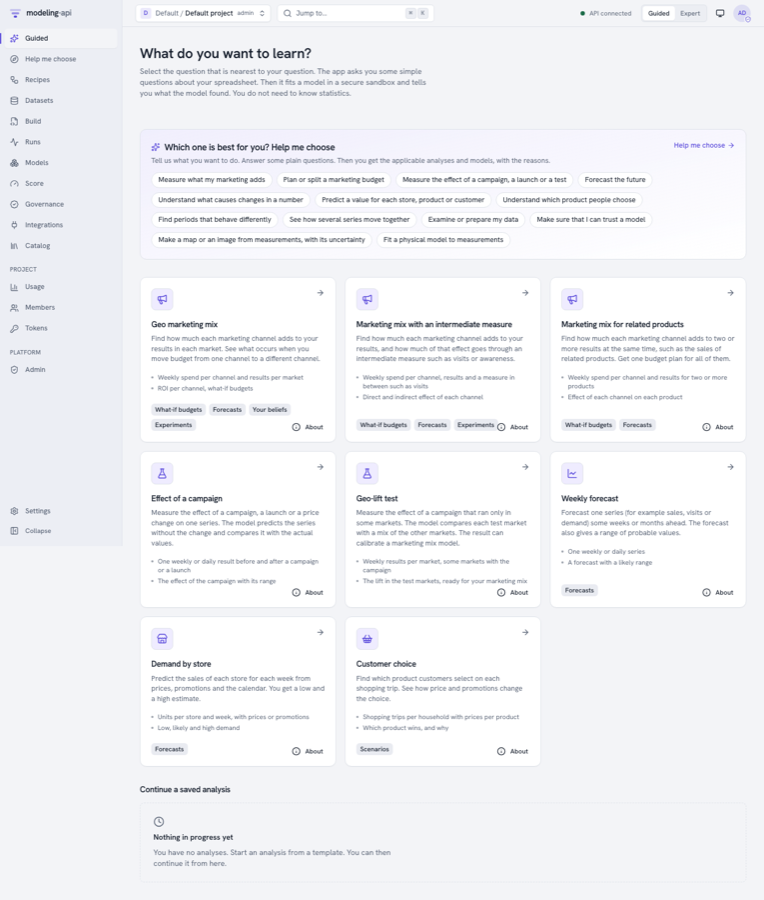
- Select what you want to learn. Answer questions such as "which column is revenue?". The platform suggests the answer and tells you why.
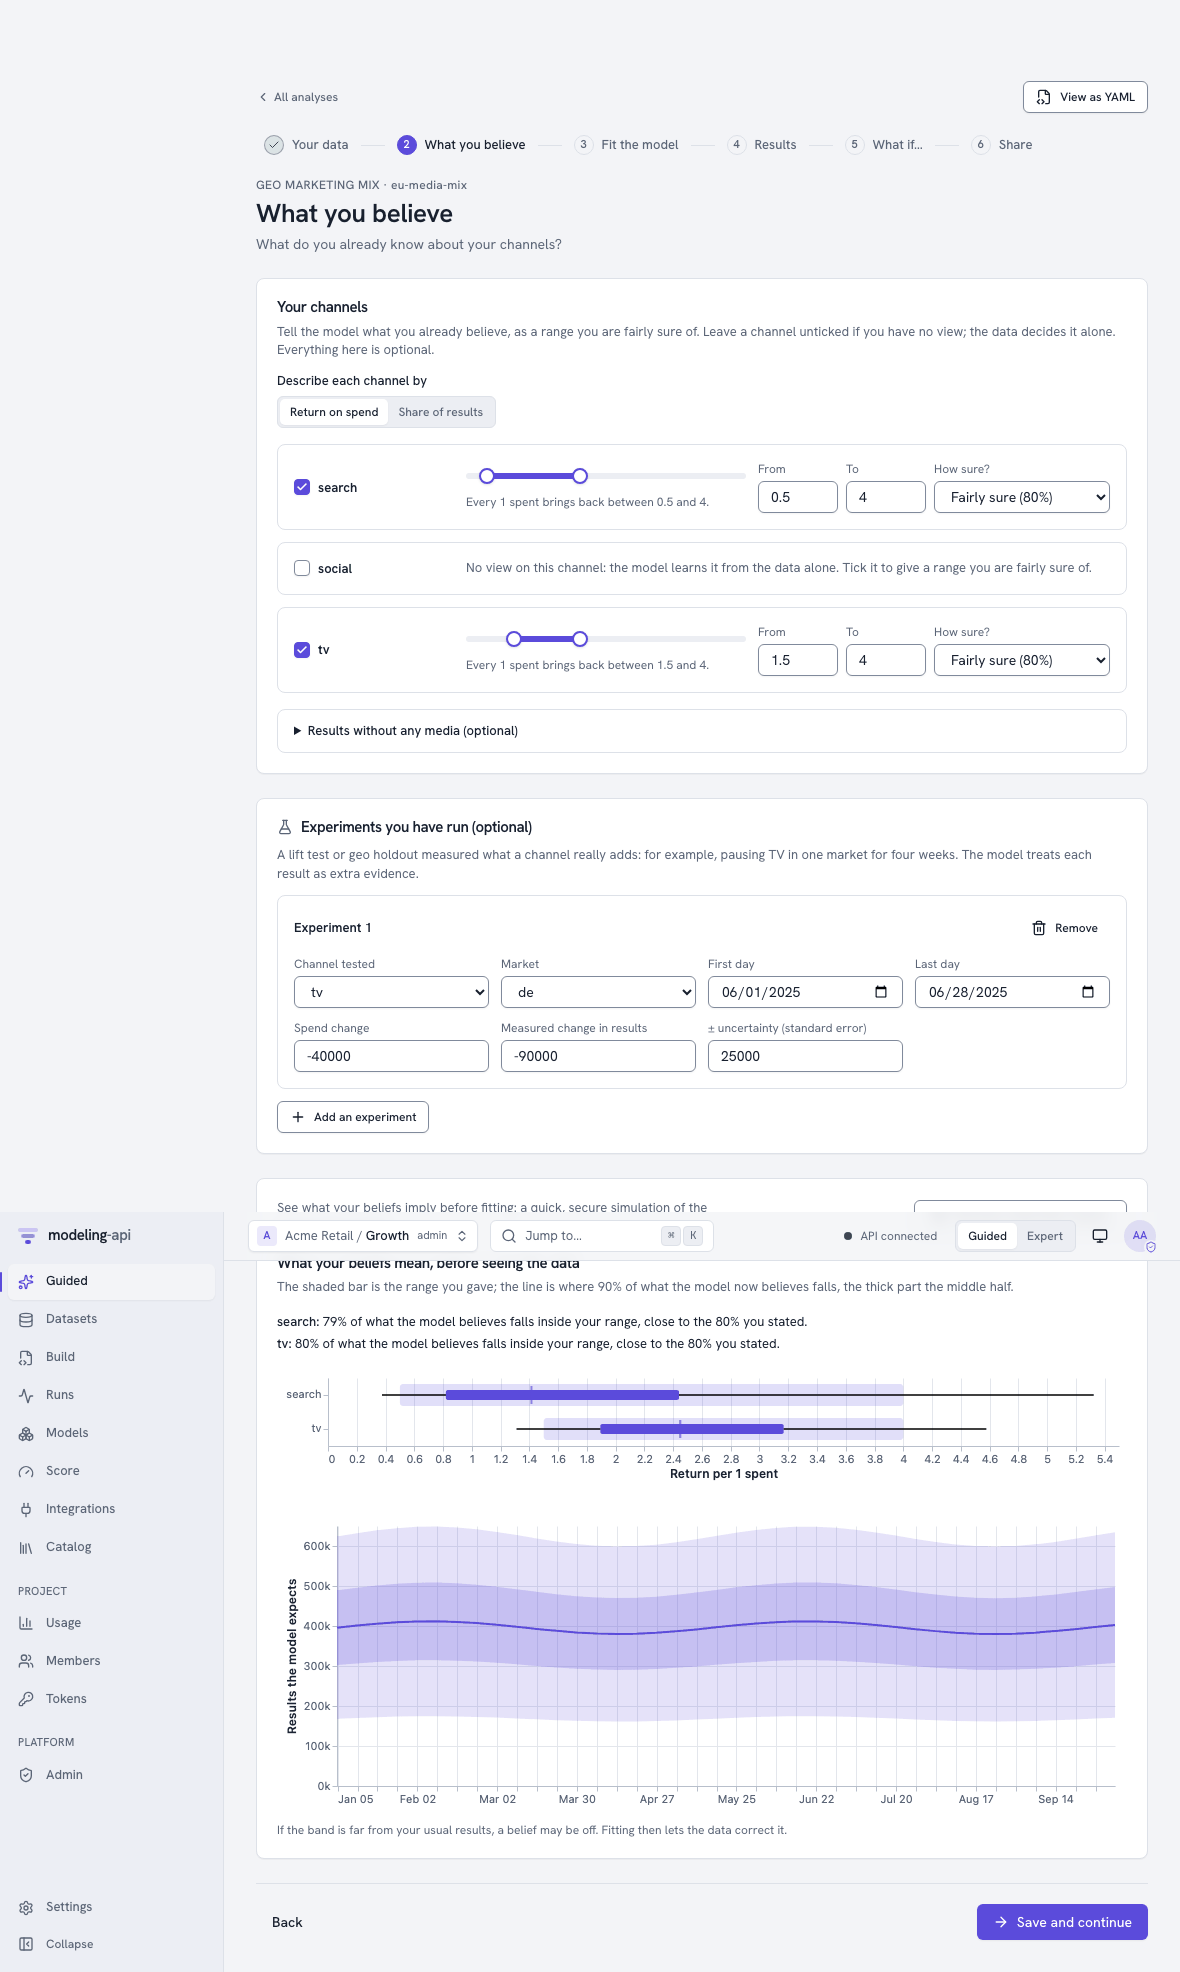
- Tell what you already believe ("TV returns 1.5 to 4 per euro"), or enter a lift test.
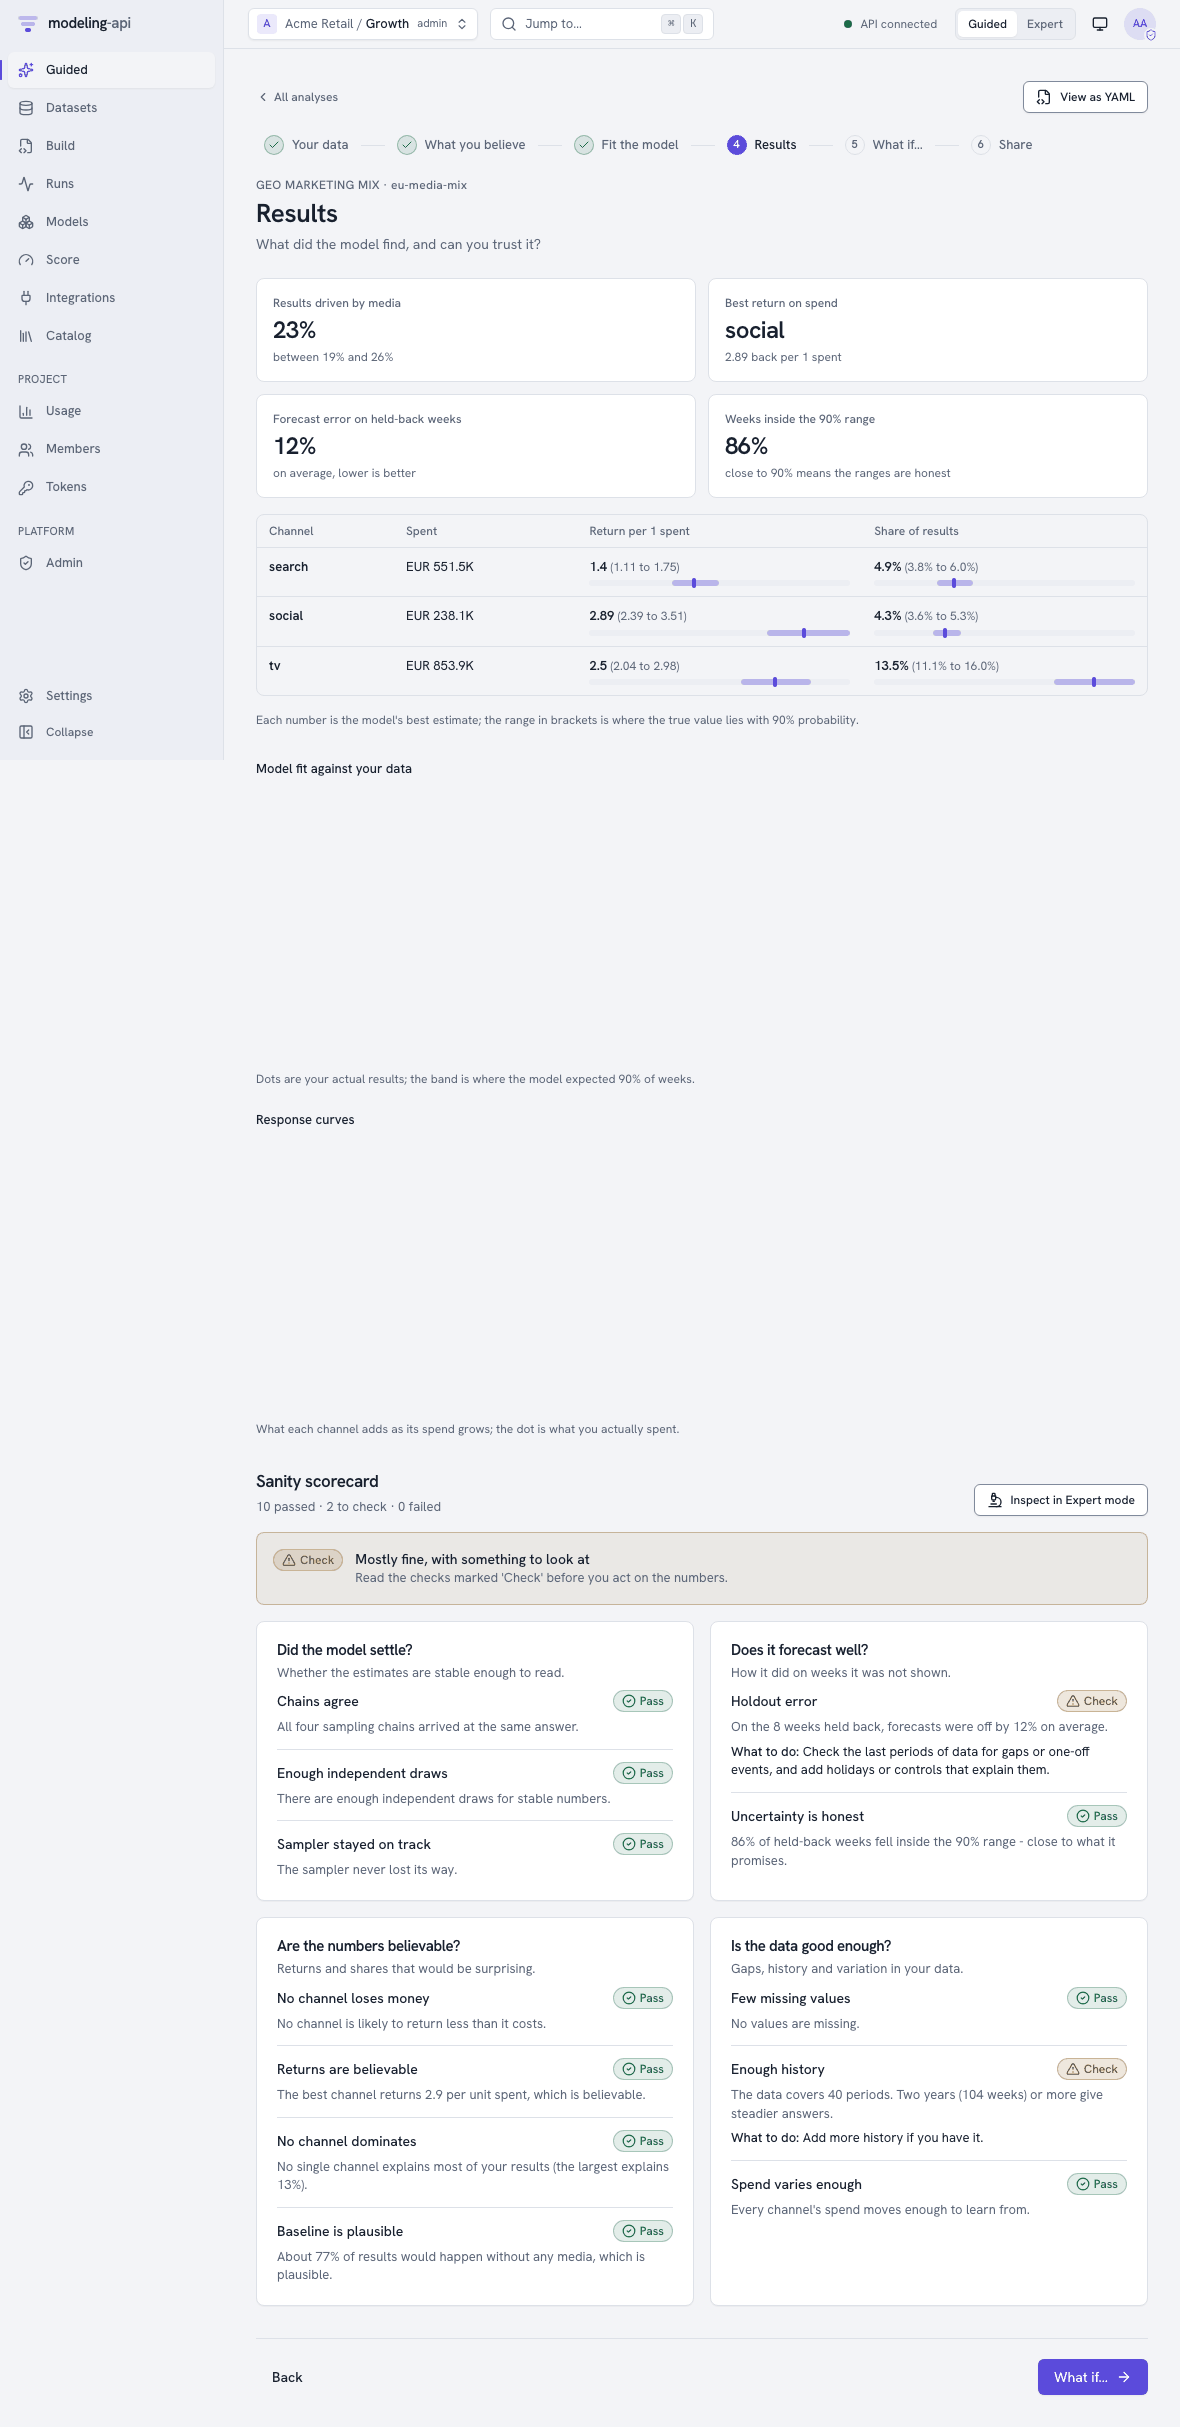
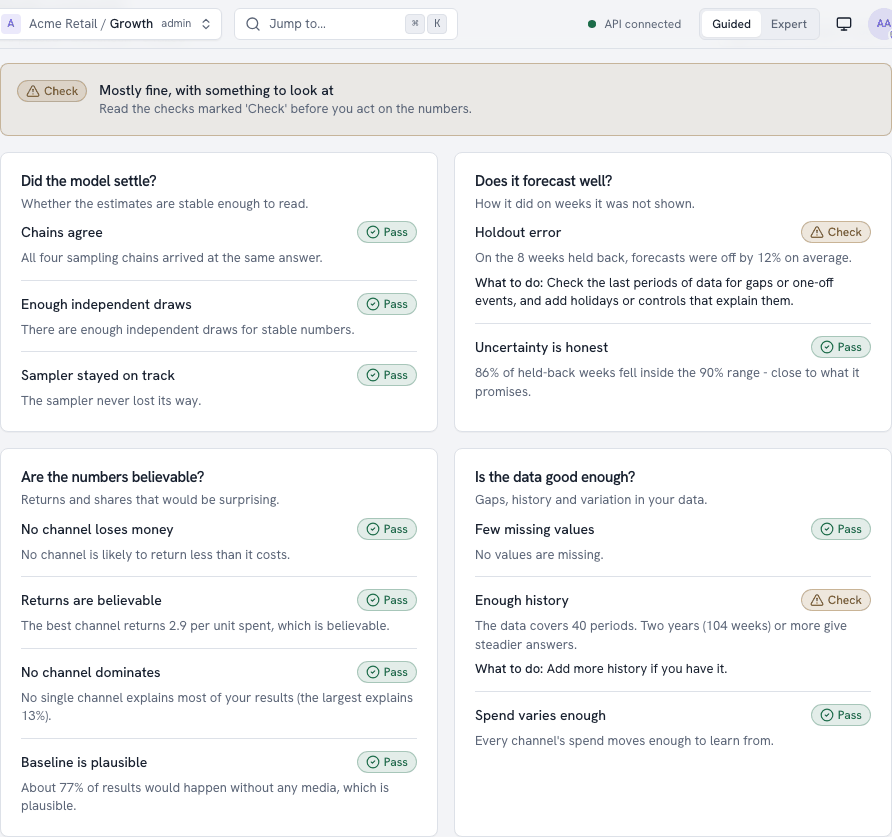
- Read a report in plain words. A sanity scorecard tells you if you can trust it.
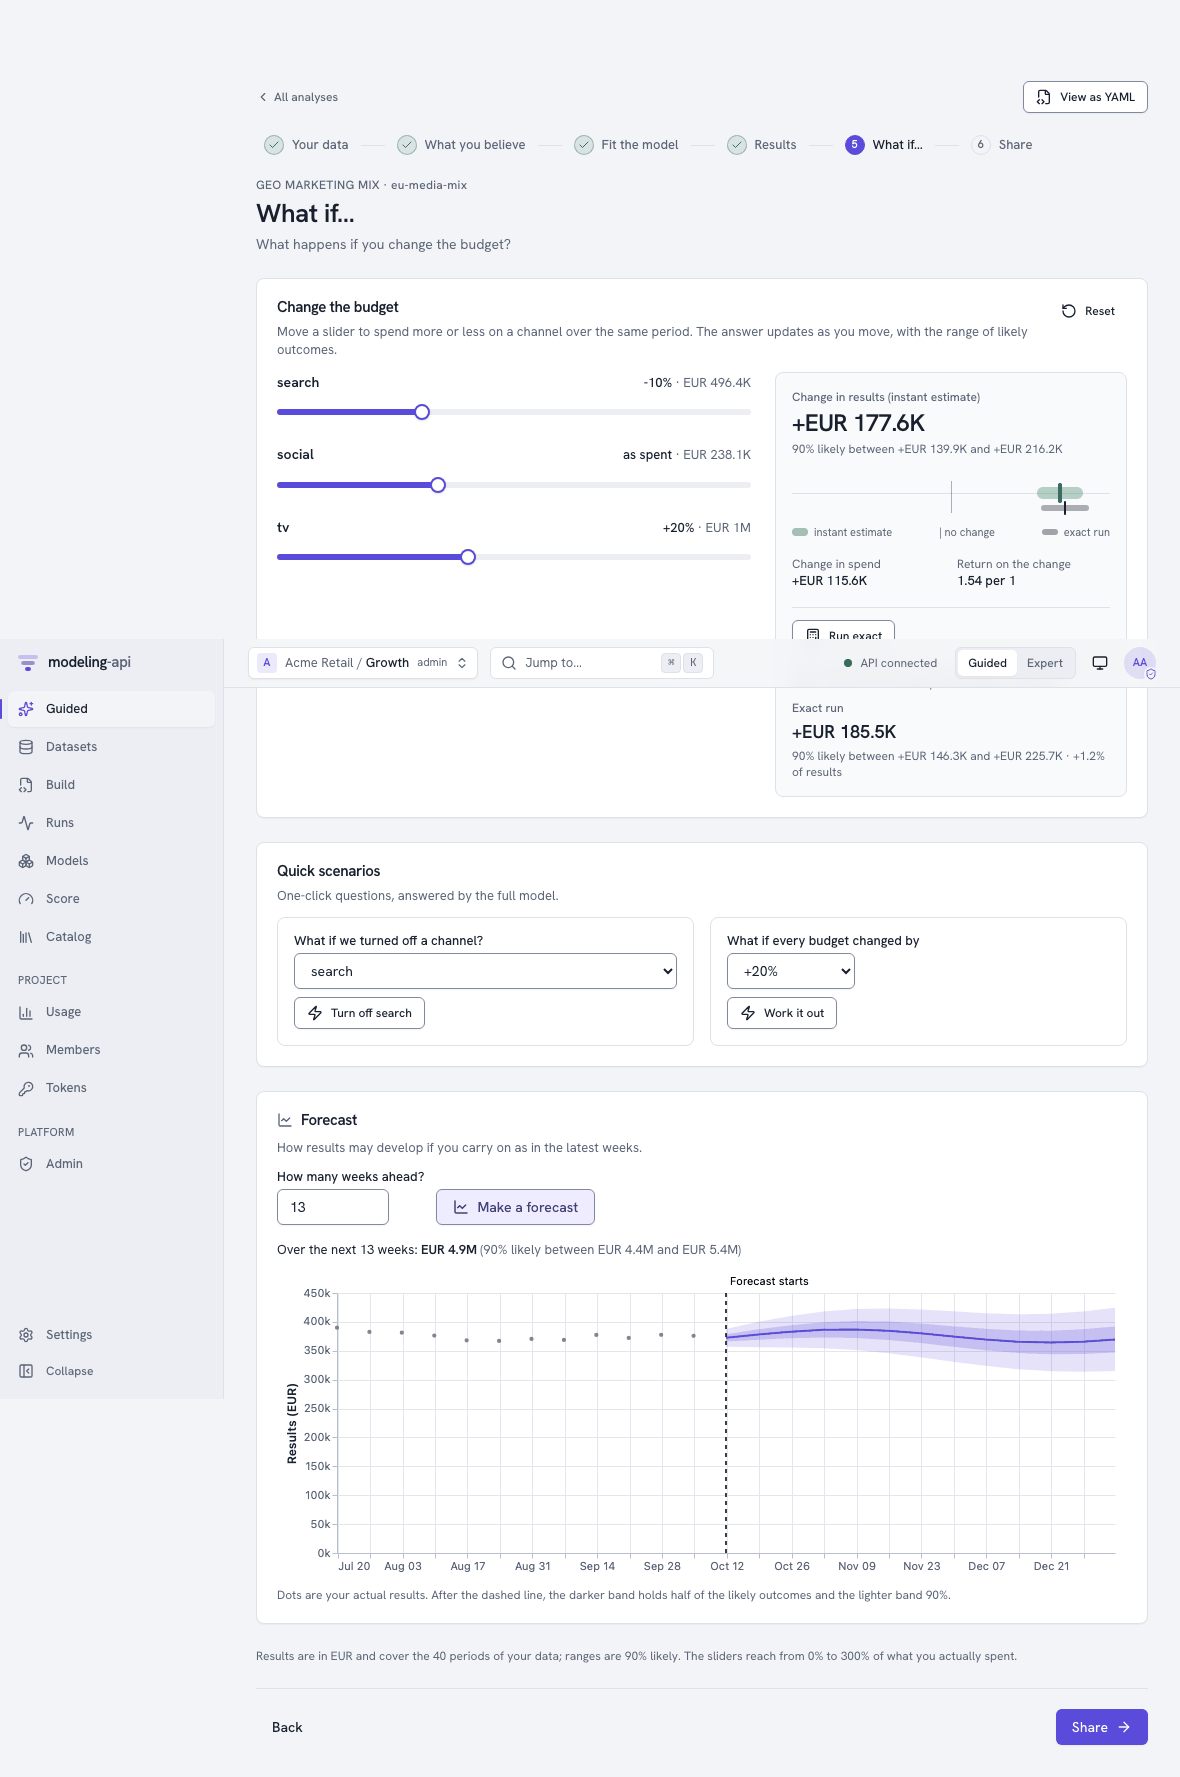
- Move the what-if sliders. Your browser gives the answers. The range stays honest when some channels move at the same time. "Run exact" asks the full model.
- Share a live chart, or put the model in a Google Sheet.
- Measure the effect of a campaign or a geo-lift test with the Effect of a campaign and Geo-lift test templates. Use the result as a lift test for your marketing mix.
- If you are not sure which model to use, use Help me choose. It asks some questions and explains its recommendations. Each option has an About card in plain words.
Data scientists
Any PyMC, scikit-learn, JAX or forecasting model. The same preprocessing, exactly. Endpoints in one click.
- A PyMC model is one
build()method. An sklearn model is oneestimator(). Built-in marketing-mix, forecasting, causal, demand, choice and classification models are ready to use. So are 15 science models and three neural networks for tables and images. - Each run logs its metrics, params, tags and images. Log your own from model code, a
notebook or
mapi runs log-metric. Filter, sort and compare 2 to 10 runs side by side, and group them in experiments. - Steps learn on the training data only. At score time, the platform replays them and does not fit them again. This applies to forecasts, new markets and counterfactuals.
- Uncertainty is a primary part of each result: draws, quantiles or intervals. Each one has the aggregations that are valid for it.
- Promote a version to an endpoint through the scorecard gate. Copy a snippet for Python, TypeScript, curl, R, Apps Script or a notebook.
- Automate the statistics with workflows of tests, branches, searches, backtests and
governance checks. Posterior summaries, predictive checks, stacking weights and plots are
nodes too. Run them live from
mapi workflows run --watchorapi.workflows.
Quickstart: zero to first model · Workflow cookbook · Track and compare runs · Science tutorials
The two groups edit the same ModelSpec. Each Guided screen has View as YAML. The
changes of an expert come back to Guided mode with no loss.
Who it is for, and who it is not for.
How it works
flowchart LR
    D["Your data<br/>CSV · Parquet · MFF ·<br/>Meridian · NetCDF · HDF5 ·<br/>images"] --> I["Sandboxed ingest<br/>checked, profiled,<br/>dims and roles"]
    Q["Guided answers<br/>or a YAML spec"] --> V{{"Static checks<br/>before any compute"}}
    I --> V
    V --> F["Fit in a fresh sandbox<br/>preprocessing learned<br/>on train only"]
    F --> B[("Signed bundle<br/>states · posterior ·<br/>scorecard · grids")]
    F -.-> T["Run tracking<br/>metrics · params ·<br/>images · compare"]
    W["Workflow<br/>tests → decisions →<br/>search → backtest"] -.-> F
    B --> R["Report, explorers,<br/>what-if, budget plans"]
    B --> G{{"Governance<br/>null tests · benchmarks ·<br/>second-person approval"}}
    G --> E["Endpoint<br/>gated on the scorecard<br/>and the validation"]
E --> S["Sheets · BI embeds ·<br/>webhooks ·<br/>Python, TS, R"]- Your data stays labelled. The upload becomes an
xr.Datasetwith named dims, roles and units. No later part of the process uses the position of the data. - Mistakes fail early. Examples are a spec that leaks the holdout, a forecast past the limit of the model, or a market that the model did not see. You get typed errors before any compute.
- The fit learns, and the score replays. Each preprocessing step stores what it learned. Thus a forecast or a new market goes through exactly the same transformations. Then the result goes back into your units.
- The platform checks results two times. It compares the outputs with the checksums of the storage, and it signs them. The scorecard checks convergence, holdout error and plausibility.
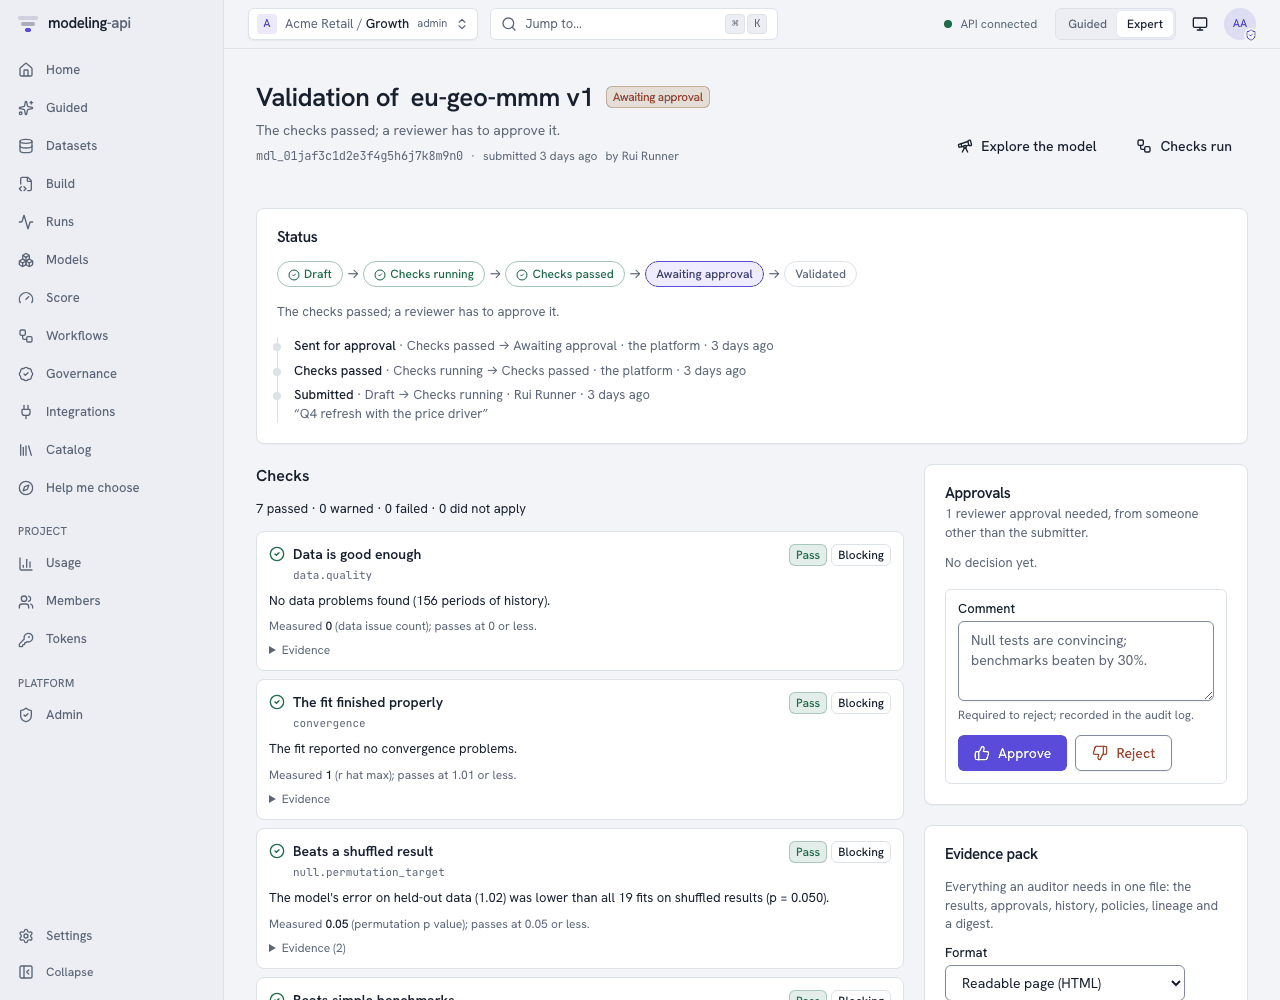
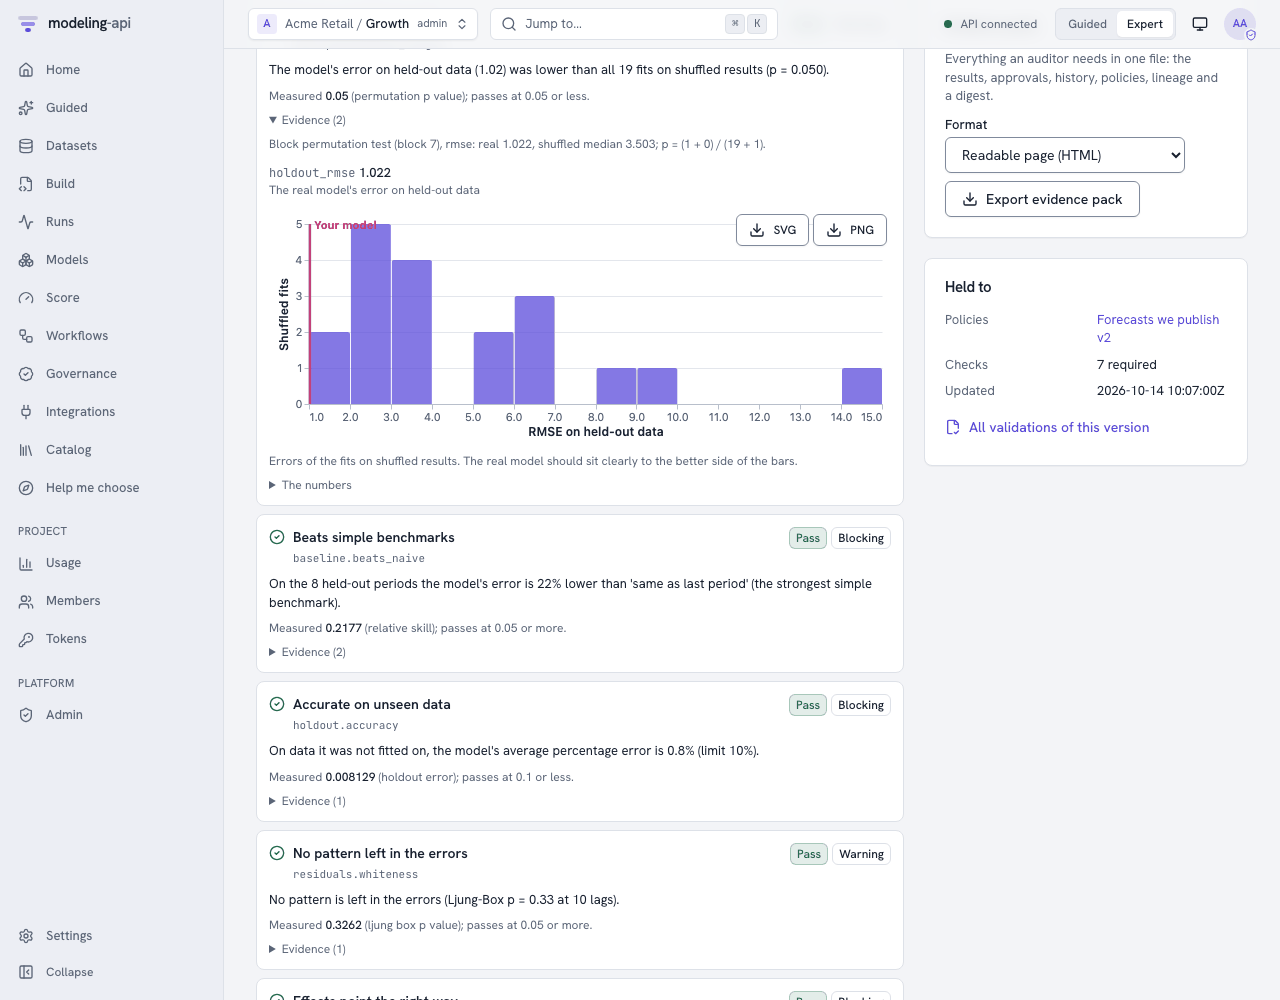
- Models must show that they are good. A governance policy applies null tests and benchmarks to each version and records the evidence. If you ask, it waits for a second person. Endpoints can refuse all versions that are not validated.
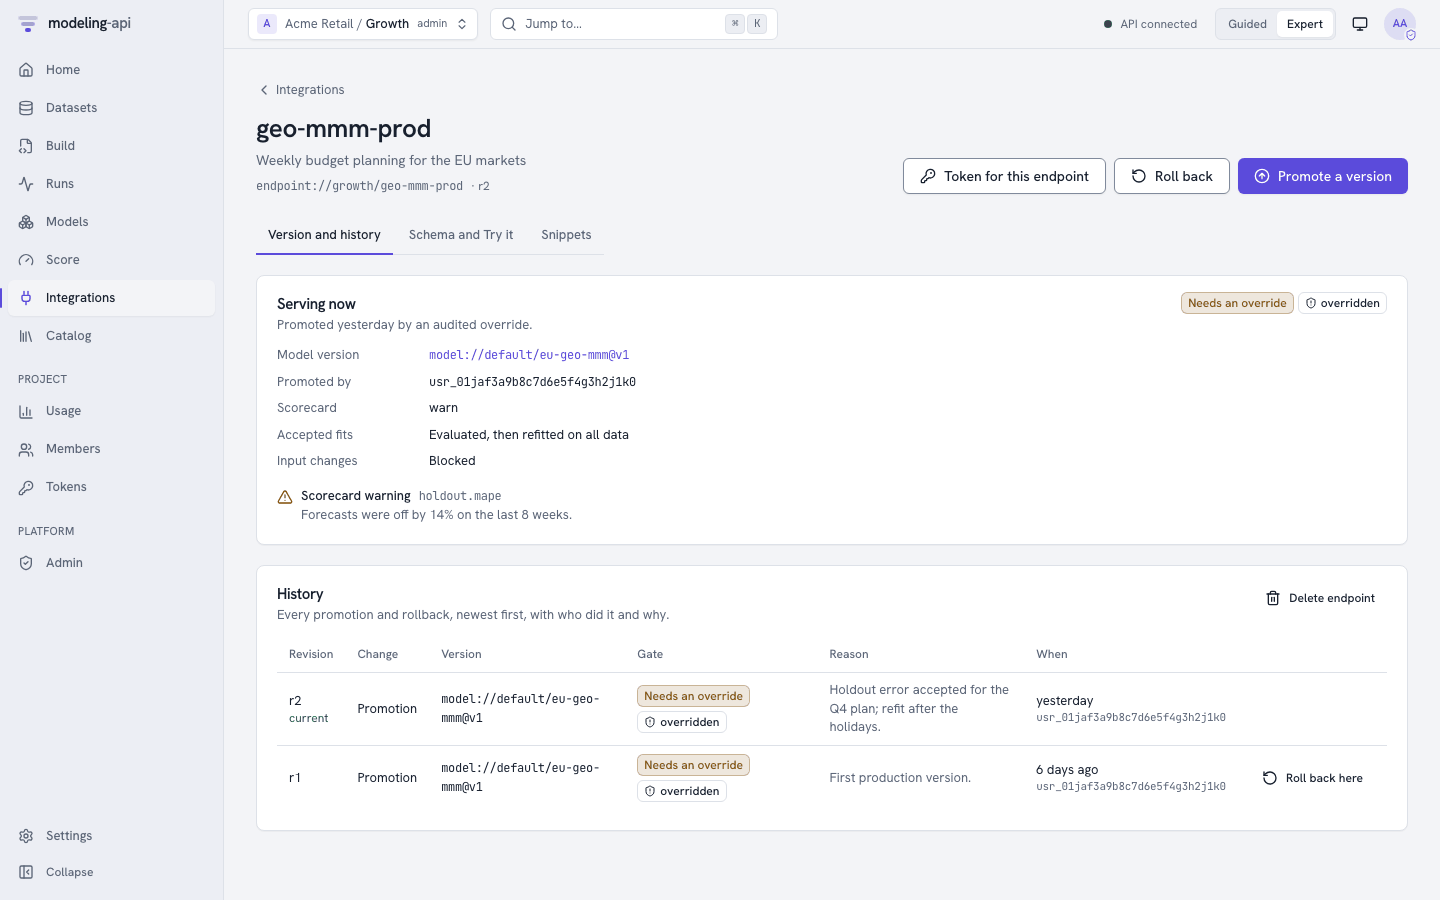
- Other tools connect to an endpoint, not to a file. Promote a better model, and all integrations use it. Roll back with one call.
- Full analyses repeat automatically. A workflow runs the tests, decisions, fits and checks again each Monday, or when the data changes. It uses again each step whose inputs did not change.
- Each run keeps its record. A run logs its metrics, params, tags and images while it runs. You can search the runs, compare them side by side and group them in experiments.
Your first MMM in Guided mode
This section shows the full path of a geo marketing-mix model. The path starts with a spreadsheet of weekly spend and revenue by region. It ends with a budget scenario. The times are from an automated "tester" on a laptop. The platform used almost all of this time. The full path took 135 seconds from upload to scenario.
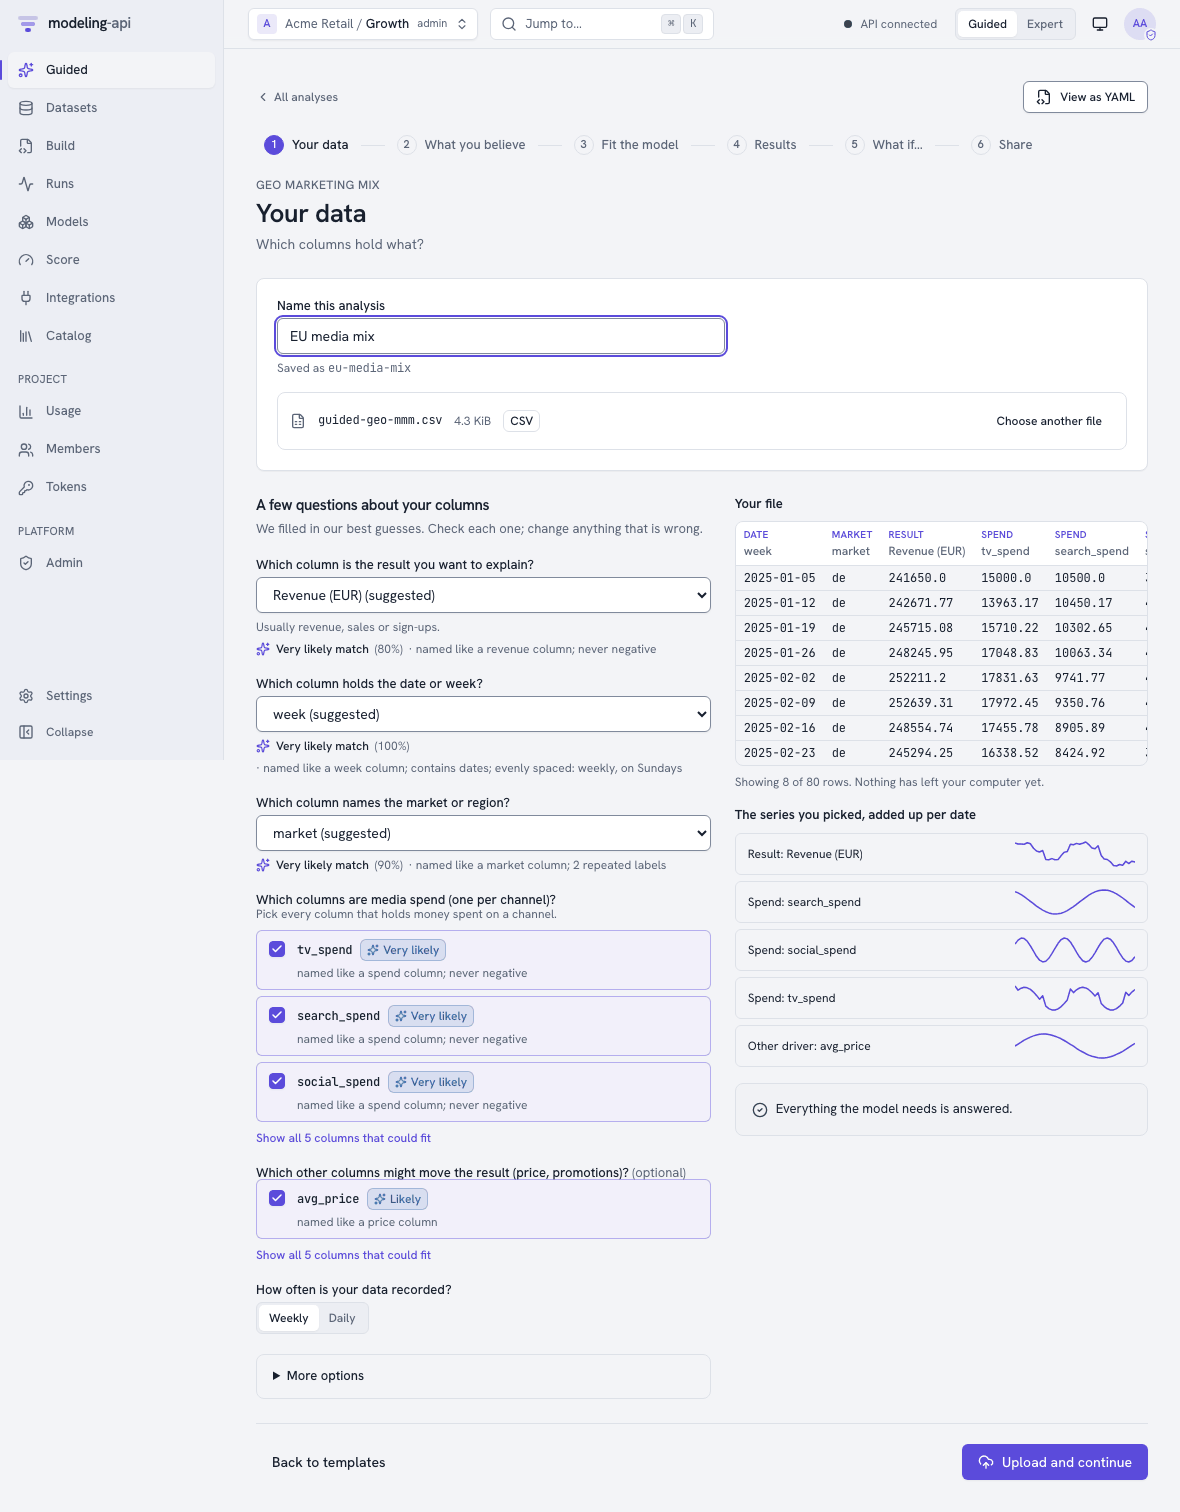
- Choose "Geo marketing mix". Then drop your CSV file on the page. The platform makes a profile of each column in your browser. It suggests which column is revenue and which columns are spend. It also tells why. (5 s)
- Say what you believe, if you have beliefs. For example, give an ROI range for each channel, or a lift test. Preview what this means shows it in business units before the fit. (22 s, optional)
- Fit the model. The progress shows in plain language. The platform tests the model on weeks that it did not see. Then it fits the model again on all the data. (80 s)
- Read the results. You see the ROI and share of each channel with 90% ranges. You also see the sanity scorecard, with the next action for each check. (instant)
- Ask "what if". Move search +20%. The change in revenue and its range show immediately. Run exact confirms the result with the full model. (30 s with the exact run and a forecast)
- Share it. Put the model live as an endpoint, or share a chart with a link.
The full tutorial, with screenshots · From a spreadsheet to a draft, with curl
What's new in v0.10 to v0.15
-
Track and compare runs
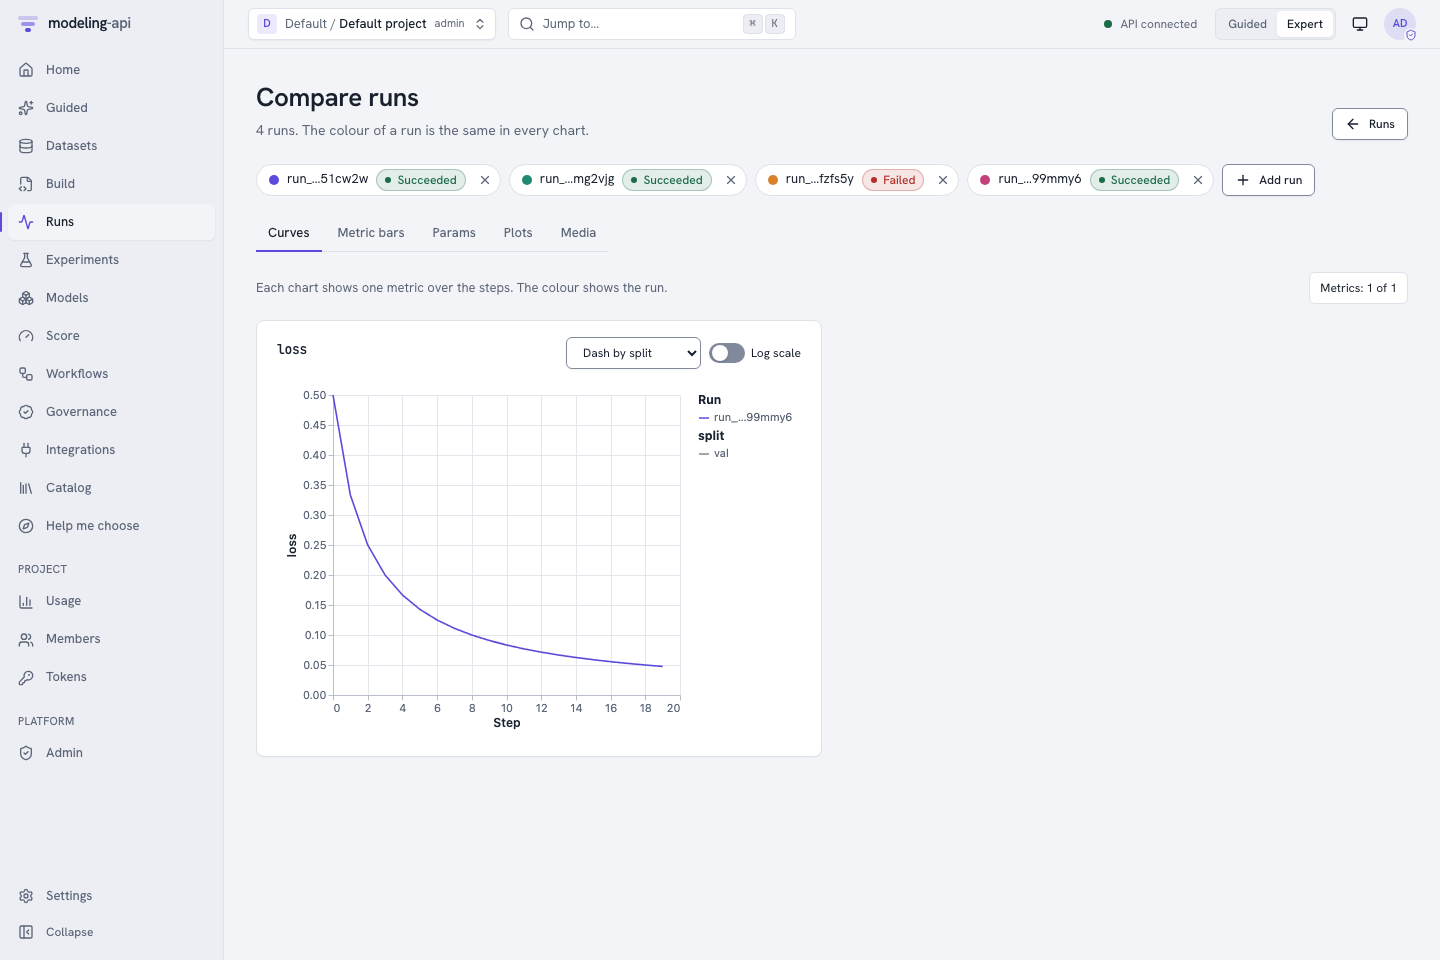
Each run keeps its metrics, params, tags, notes, log lines and images. Filter and sort the runs table by any metric, save the search as a view, and compare 2 to 10 runs side by side. An experiment groups the runs of one question.
-
Measure the effect of a change
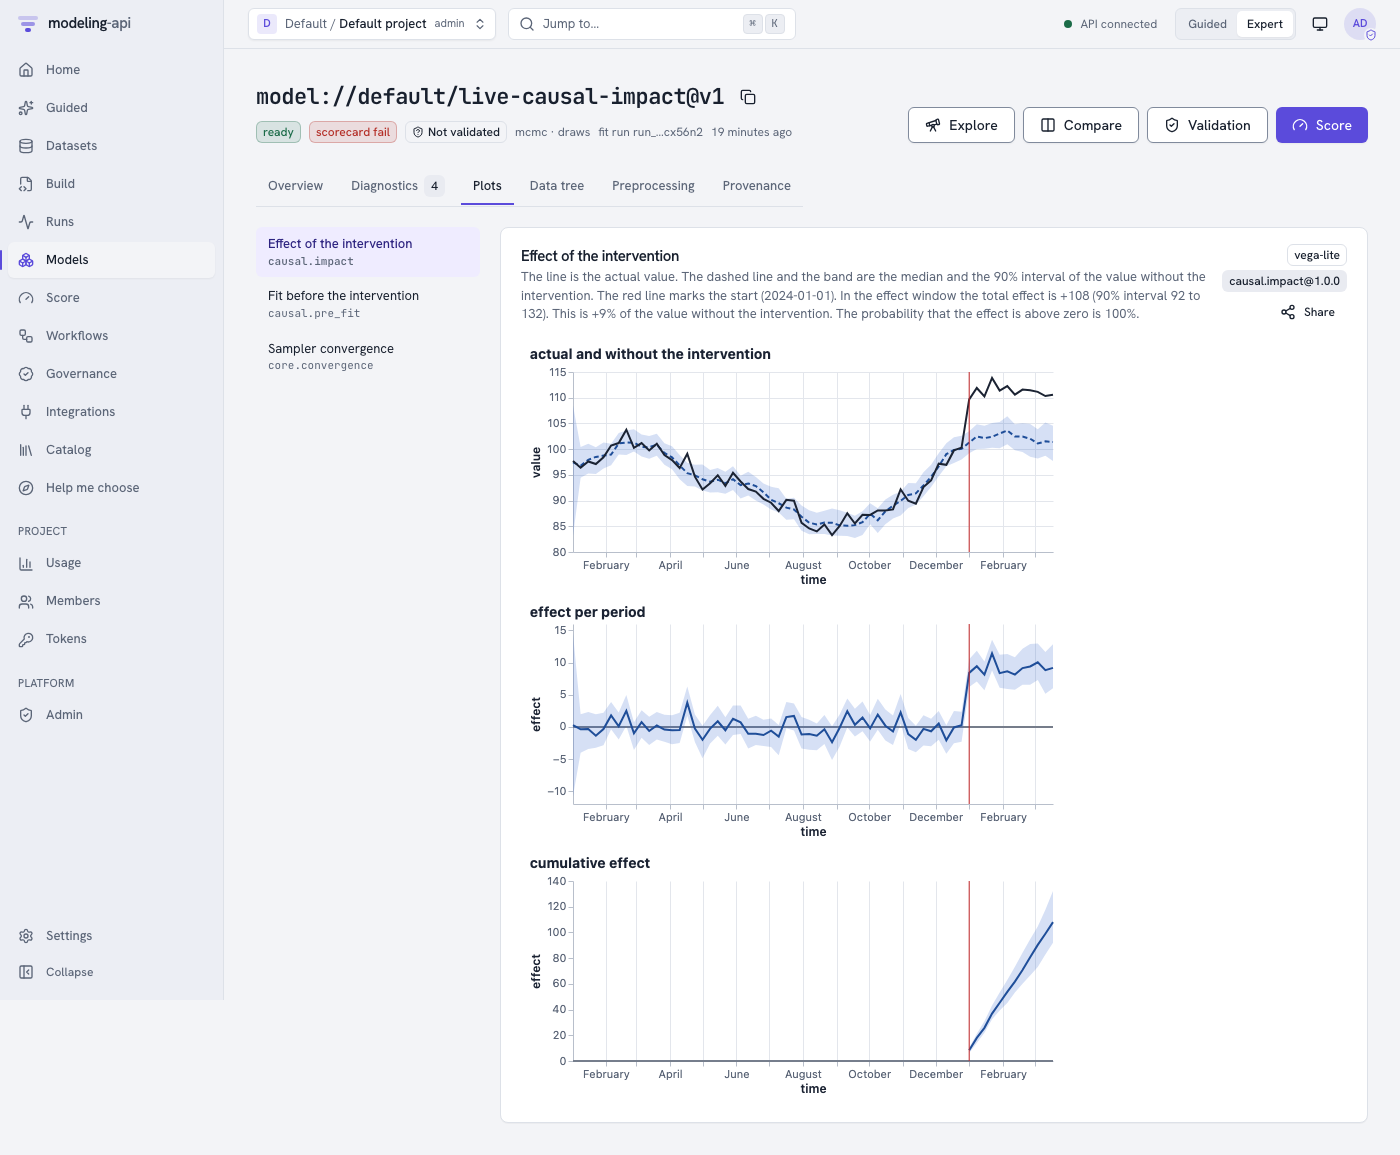
causal.impact,causal.synthetic_controlandcausal.didmeasure the effect of a campaign, a launch or a geo-lift test. The result becomes a lift test for the marketing mix.ts.bstsis a Bayesian structural time series. -
The MMM pack
mmm.nestedfor effects through visits or awareness,mmm.multivariatefor related products, effects that change over time, counts and shares, and charts for ROI, mROAS, adstock and the contribution waterfall. -
Images and deep learning
Upload a zip of small images or a collection of up to 1 000 000 images. Classify them with scikit-learn, LightGBM, CatBoost, a Bayesian model or a neural network on JAX. The resource class
GPUgives a run one NVIDIA L4.
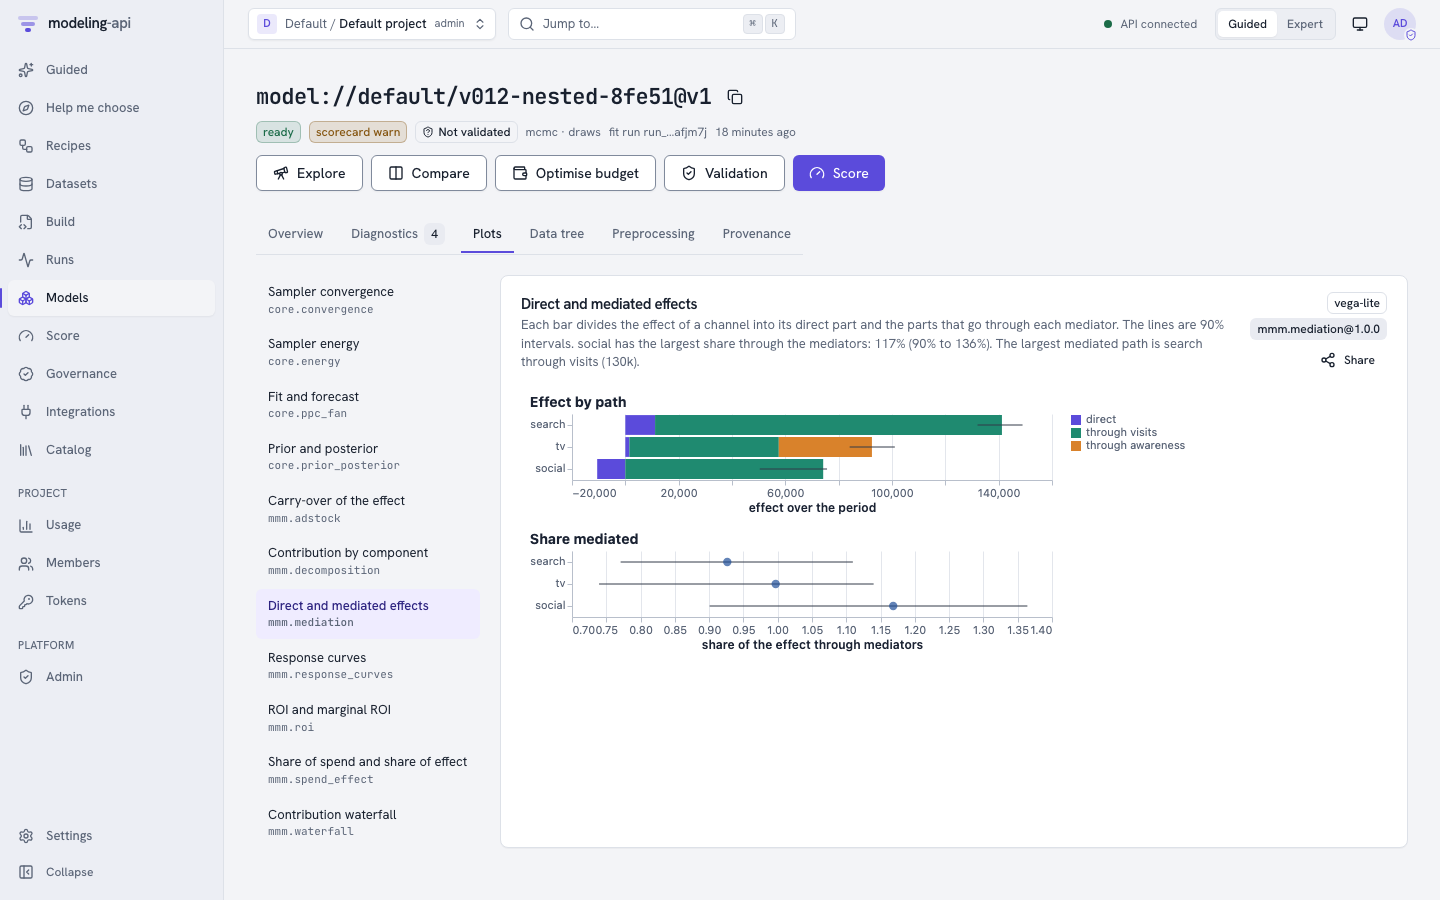
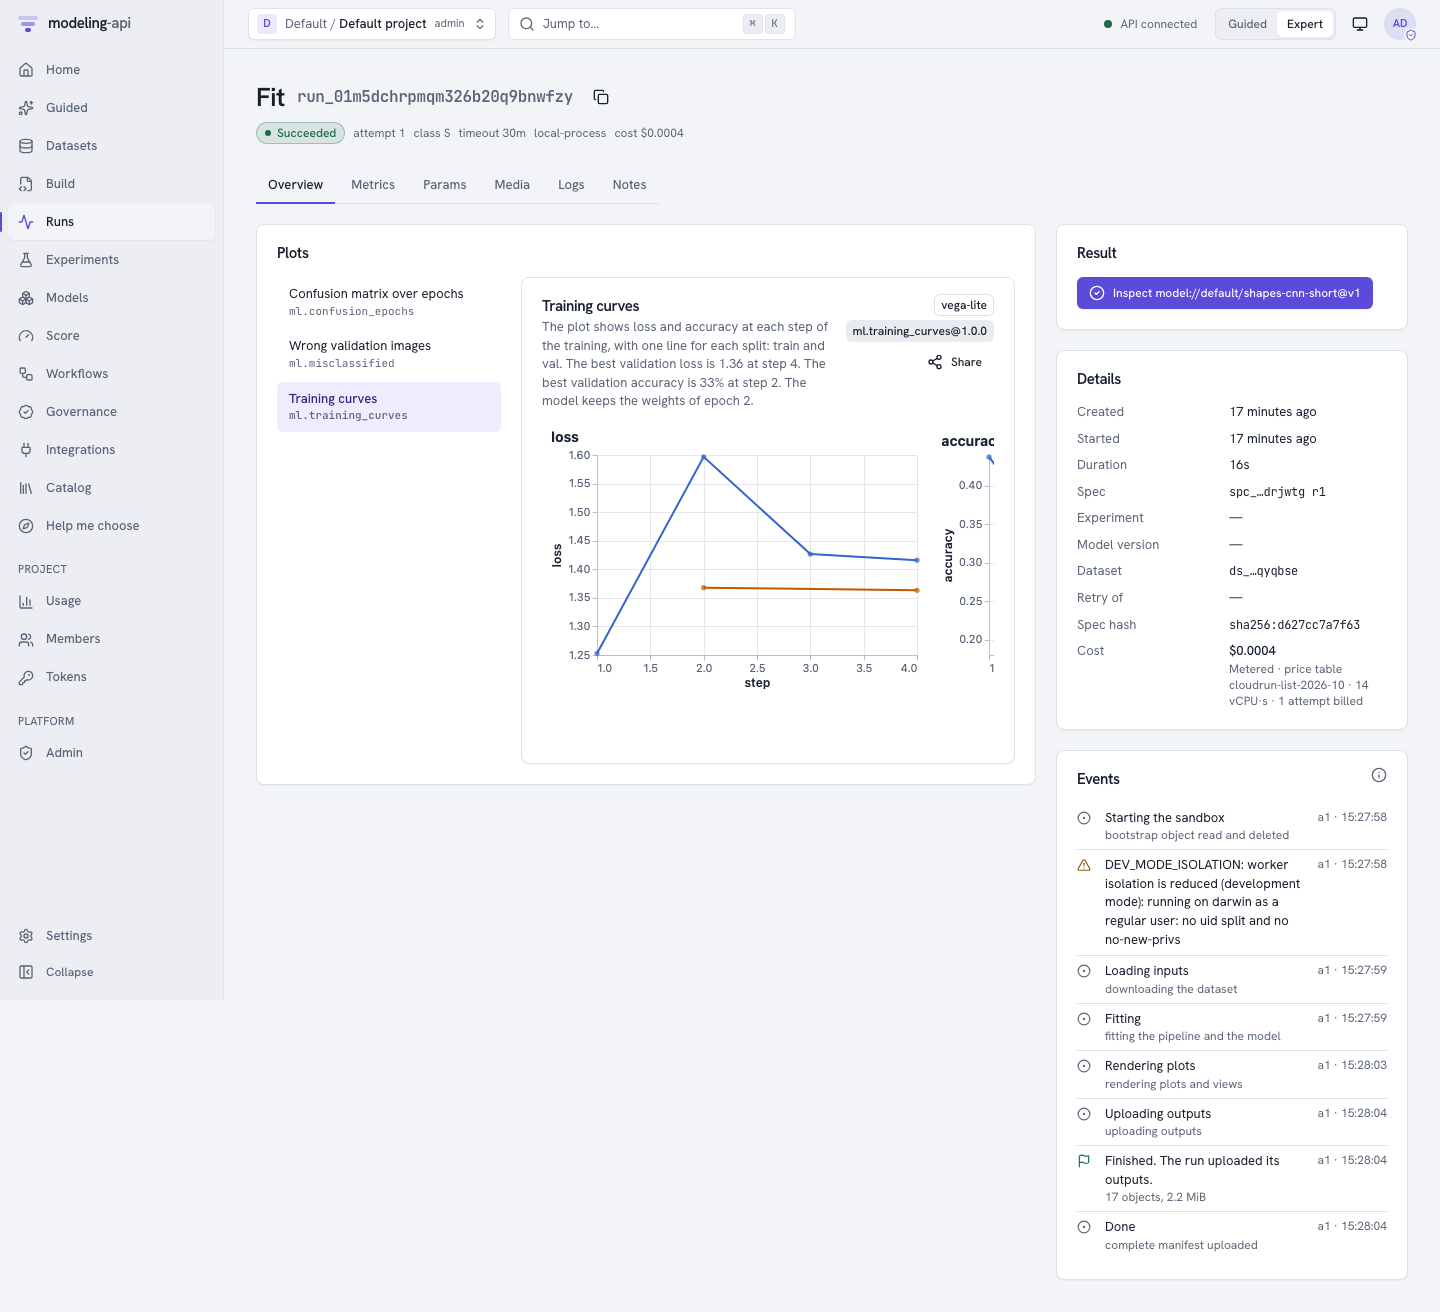
Everything that is new in 0.10 to 0.15
What came in v0.9
-
15 science models
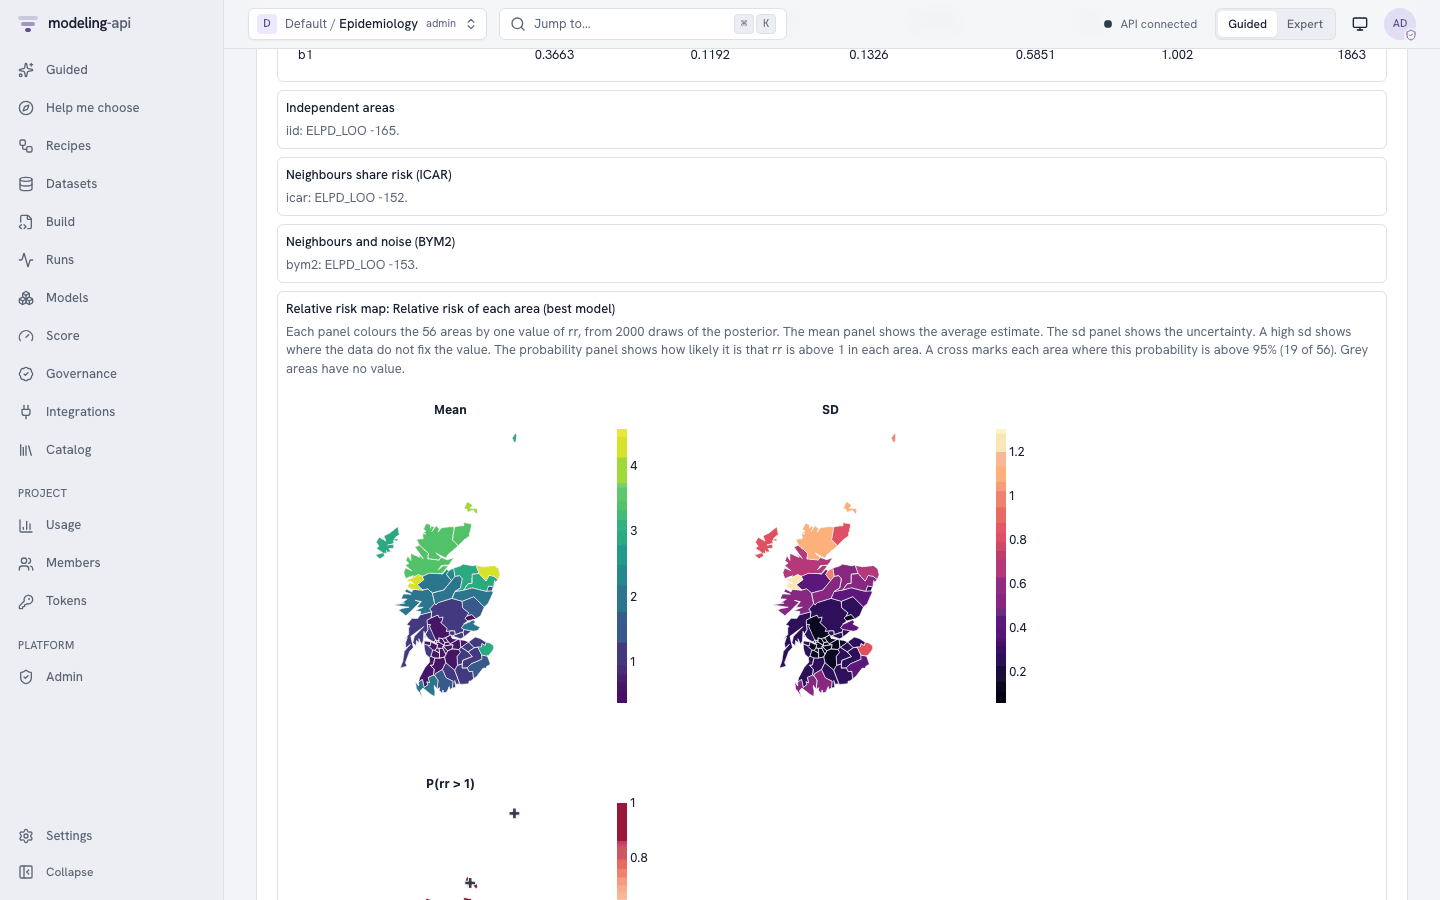
Heat equations, Turing patterns, STORM frames, small images, colour names, the CMB sky, disease maps, networks, graphical models, phylogenies and angles. Each model comes from a pymc-challenges case study and has tests against the real data of its notebook.
-
Maps, networks, trees and images
14 new plot recipes, for example area maps, network graphs, phylogenies, polar roses, image residuals, predictive image grids, colour swatches, power spectra, point patterns, corner plots and calibration plots. The catalog now has 36 recipes.
-
The Bayesian workflow as a workflow
New nodes give posterior summaries, posterior predictive checks, stacking weights, scores and plots. Six new recipes use them: model ladders, a convergence-gated audit and calibrate-then-design.
-
A tutorial for each case
Fifteen tutorials do the analysis of a notebook in the web app, with no PyMC code. The export helper writes the data of the notebook to a file that you can upload.
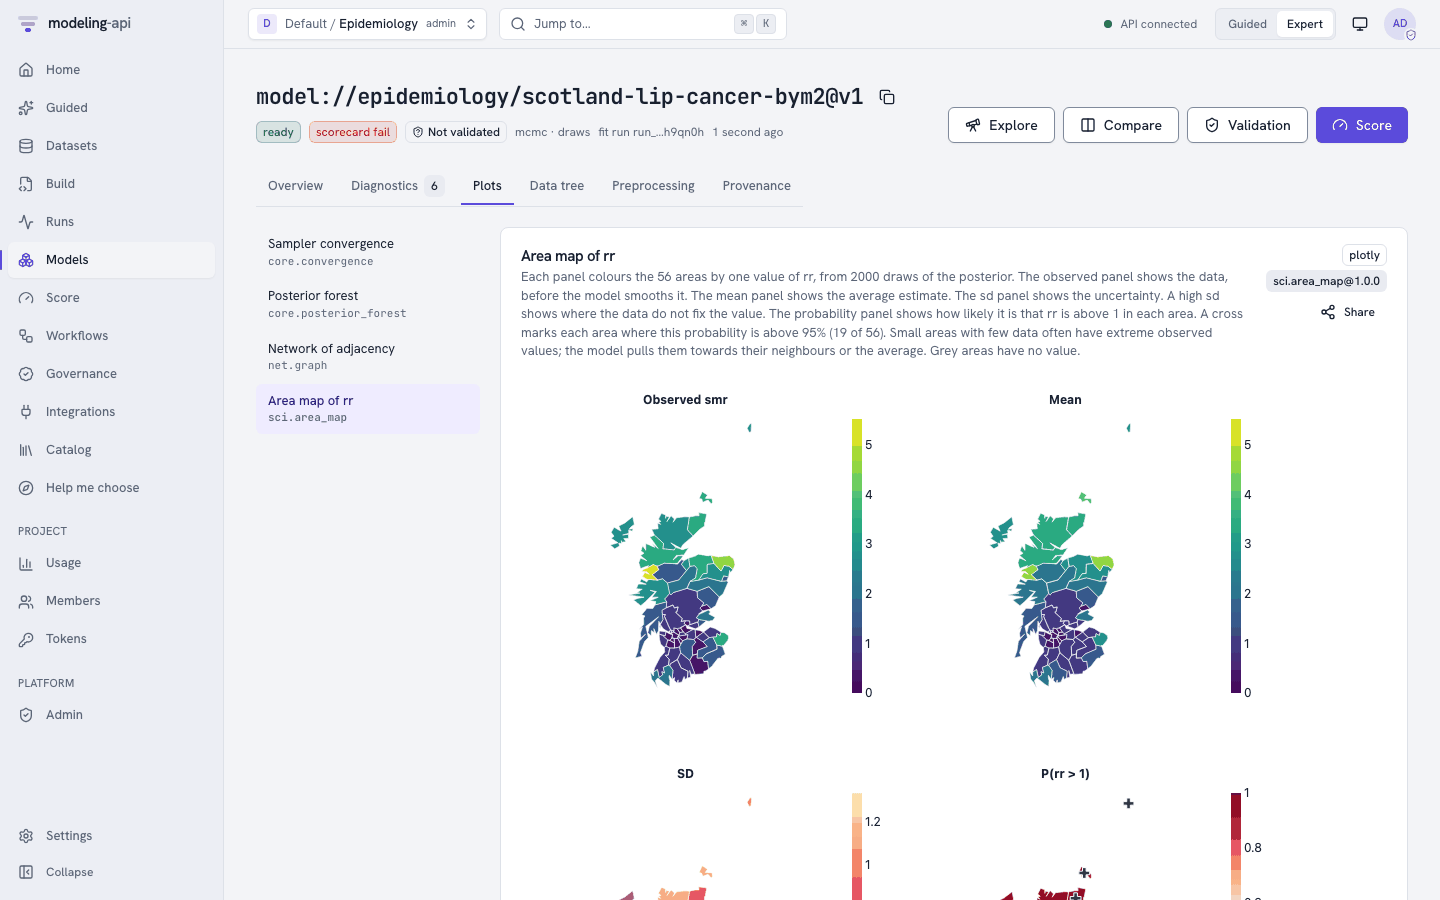
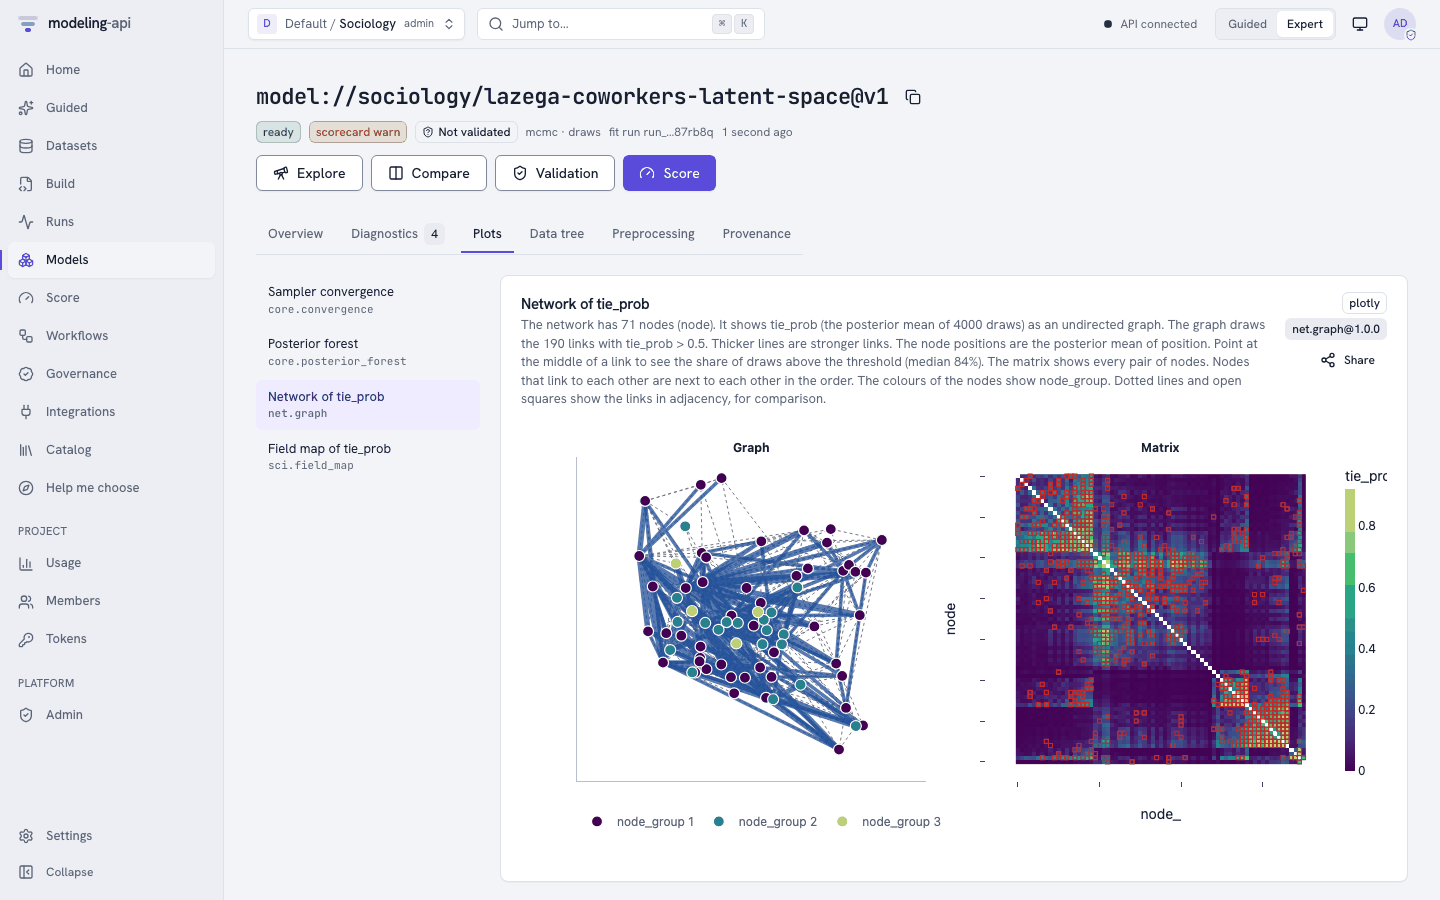
What came in v0.5
-
Workflows that think like a statistician
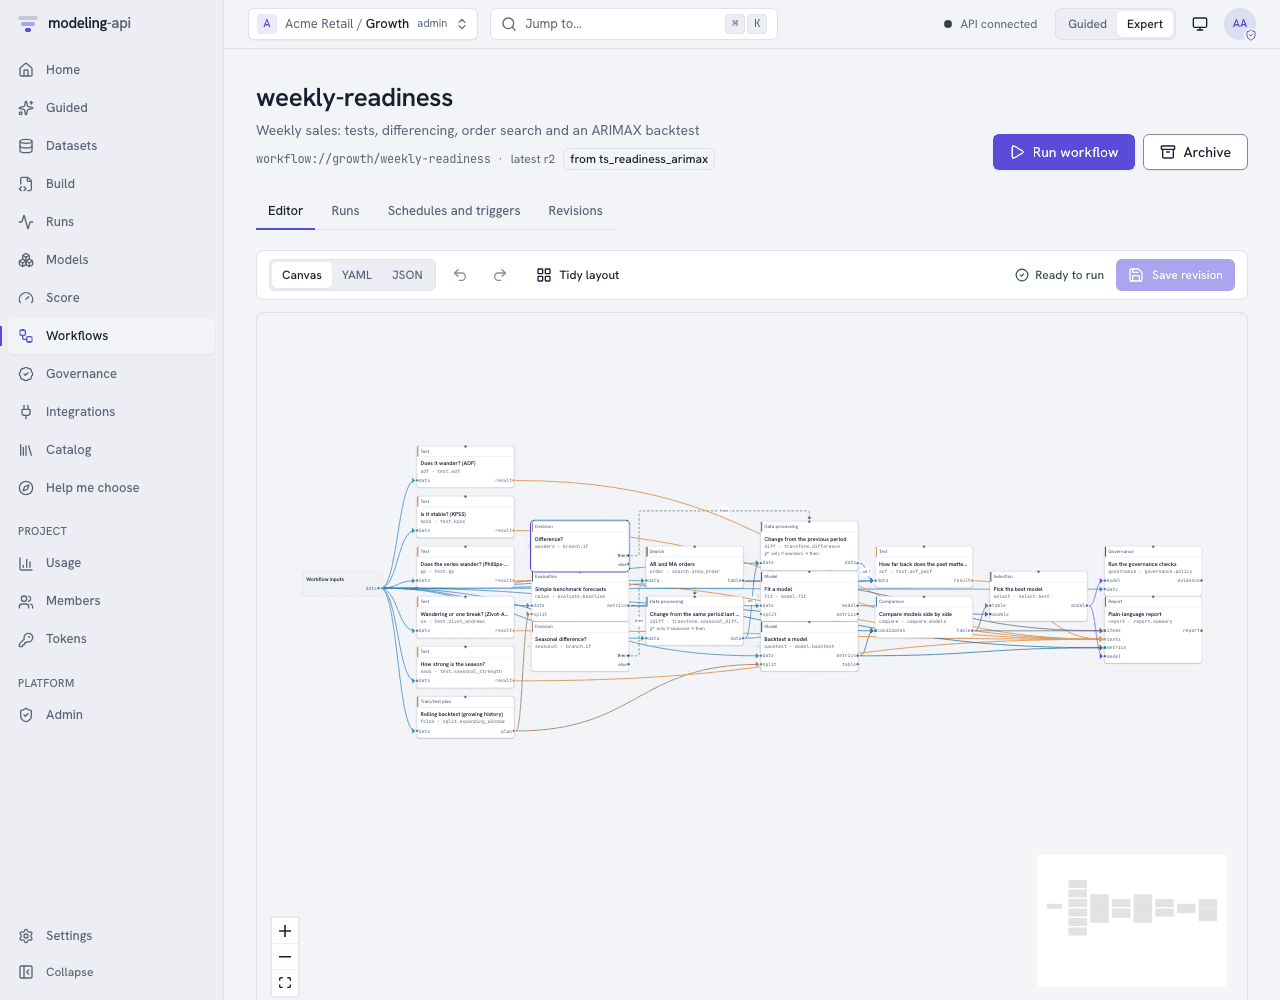
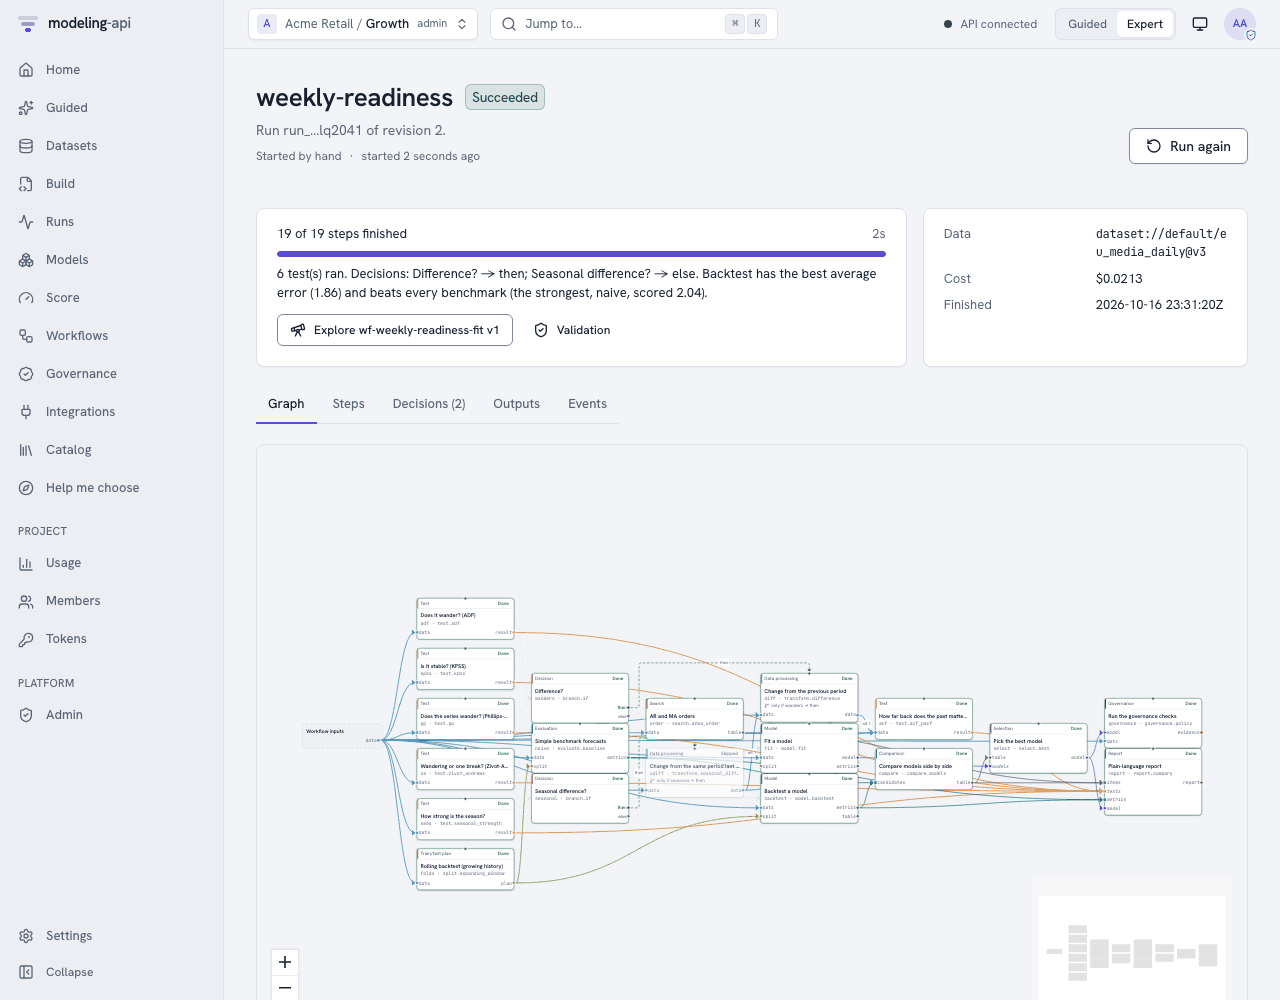
Unit roots → differencing → AR/MA orders → rolling-origin backtest → ARIMAX vs naive → select → governance. All of these steps are one versioned YAML graph. The graph has live node status, a cache, schedules and dataset triggers. It has seventeen statistical tests, seven split plans and Diebold-Mariano.
-
Models must beat noise
Governance policies have these checks: shuffled-target and placebo-regressor null tests, naive benchmarks, residual whiteness, stability, signs and prior sensitivity. They also have approval by a second person and evidence packs. Endpoints refuse models that are not validated.
-
Data and Model Explorers
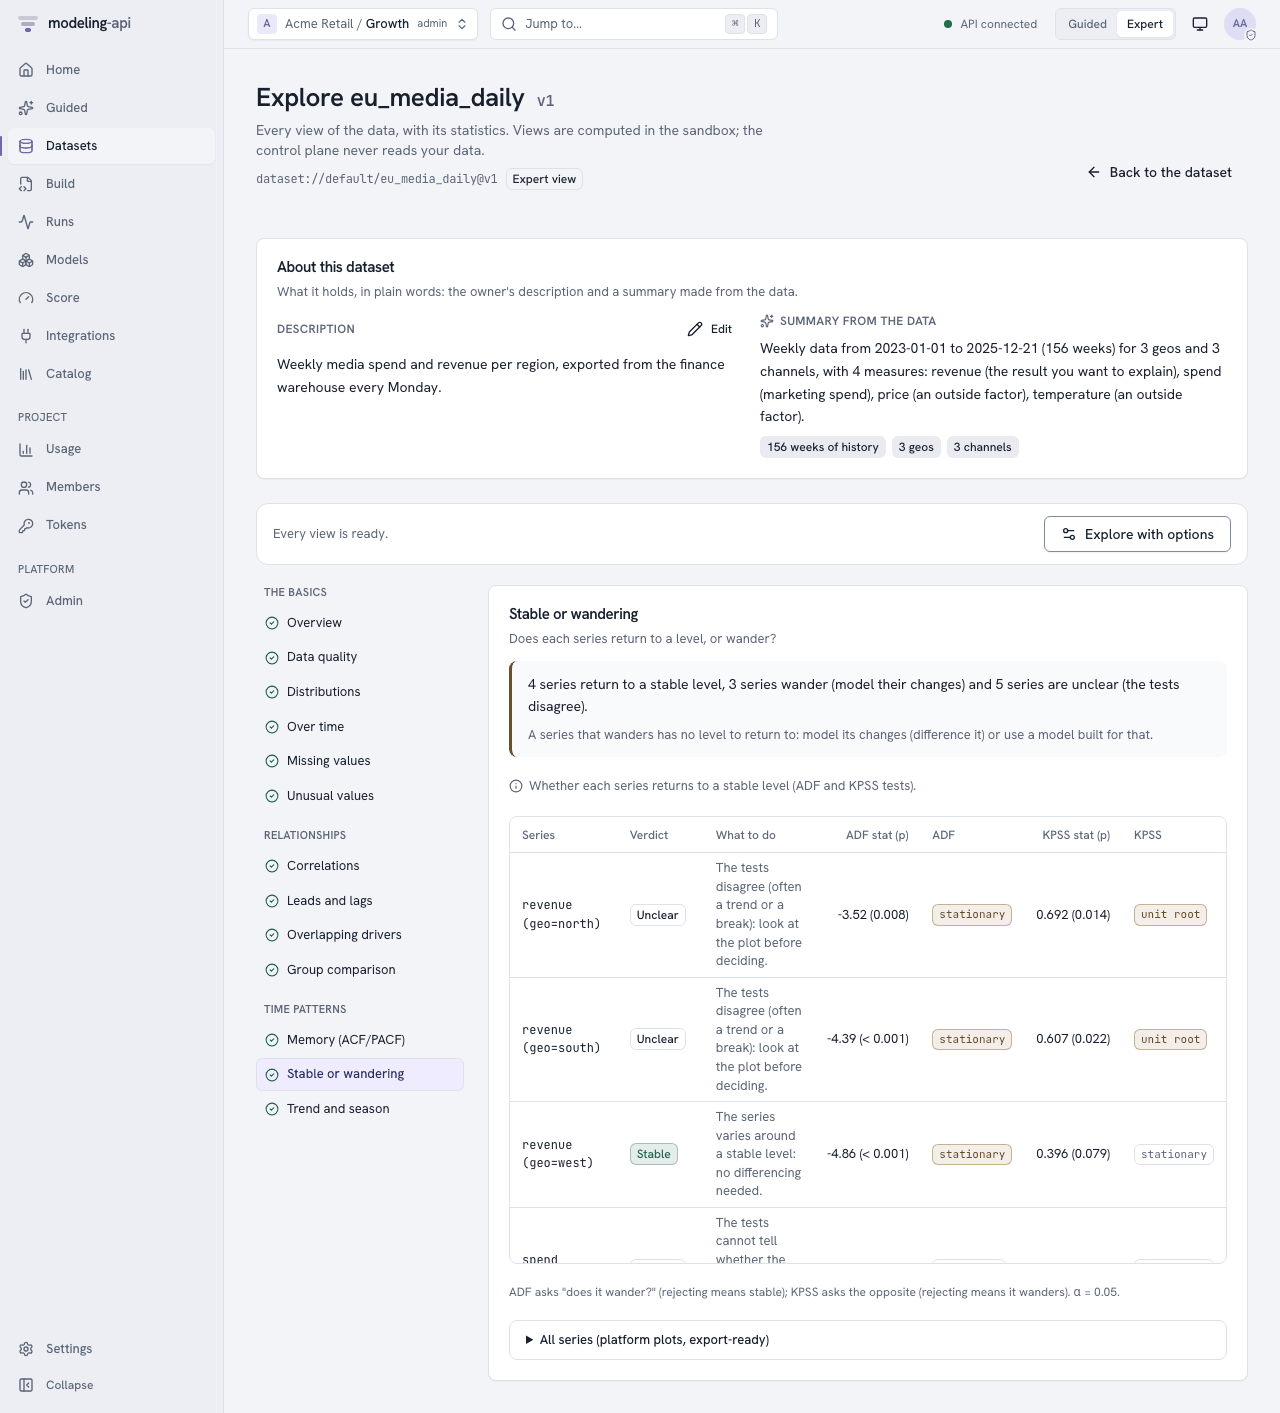
Before you make a model, see stationarity, cross-correlation with the KPI, STL, VIF and quality warnings. After the fit, see parameters, residual tests, IRF/FEVD, forecasts, backtests and side-by-side comparisons.
-
mmm-framework MMMs and budget plans
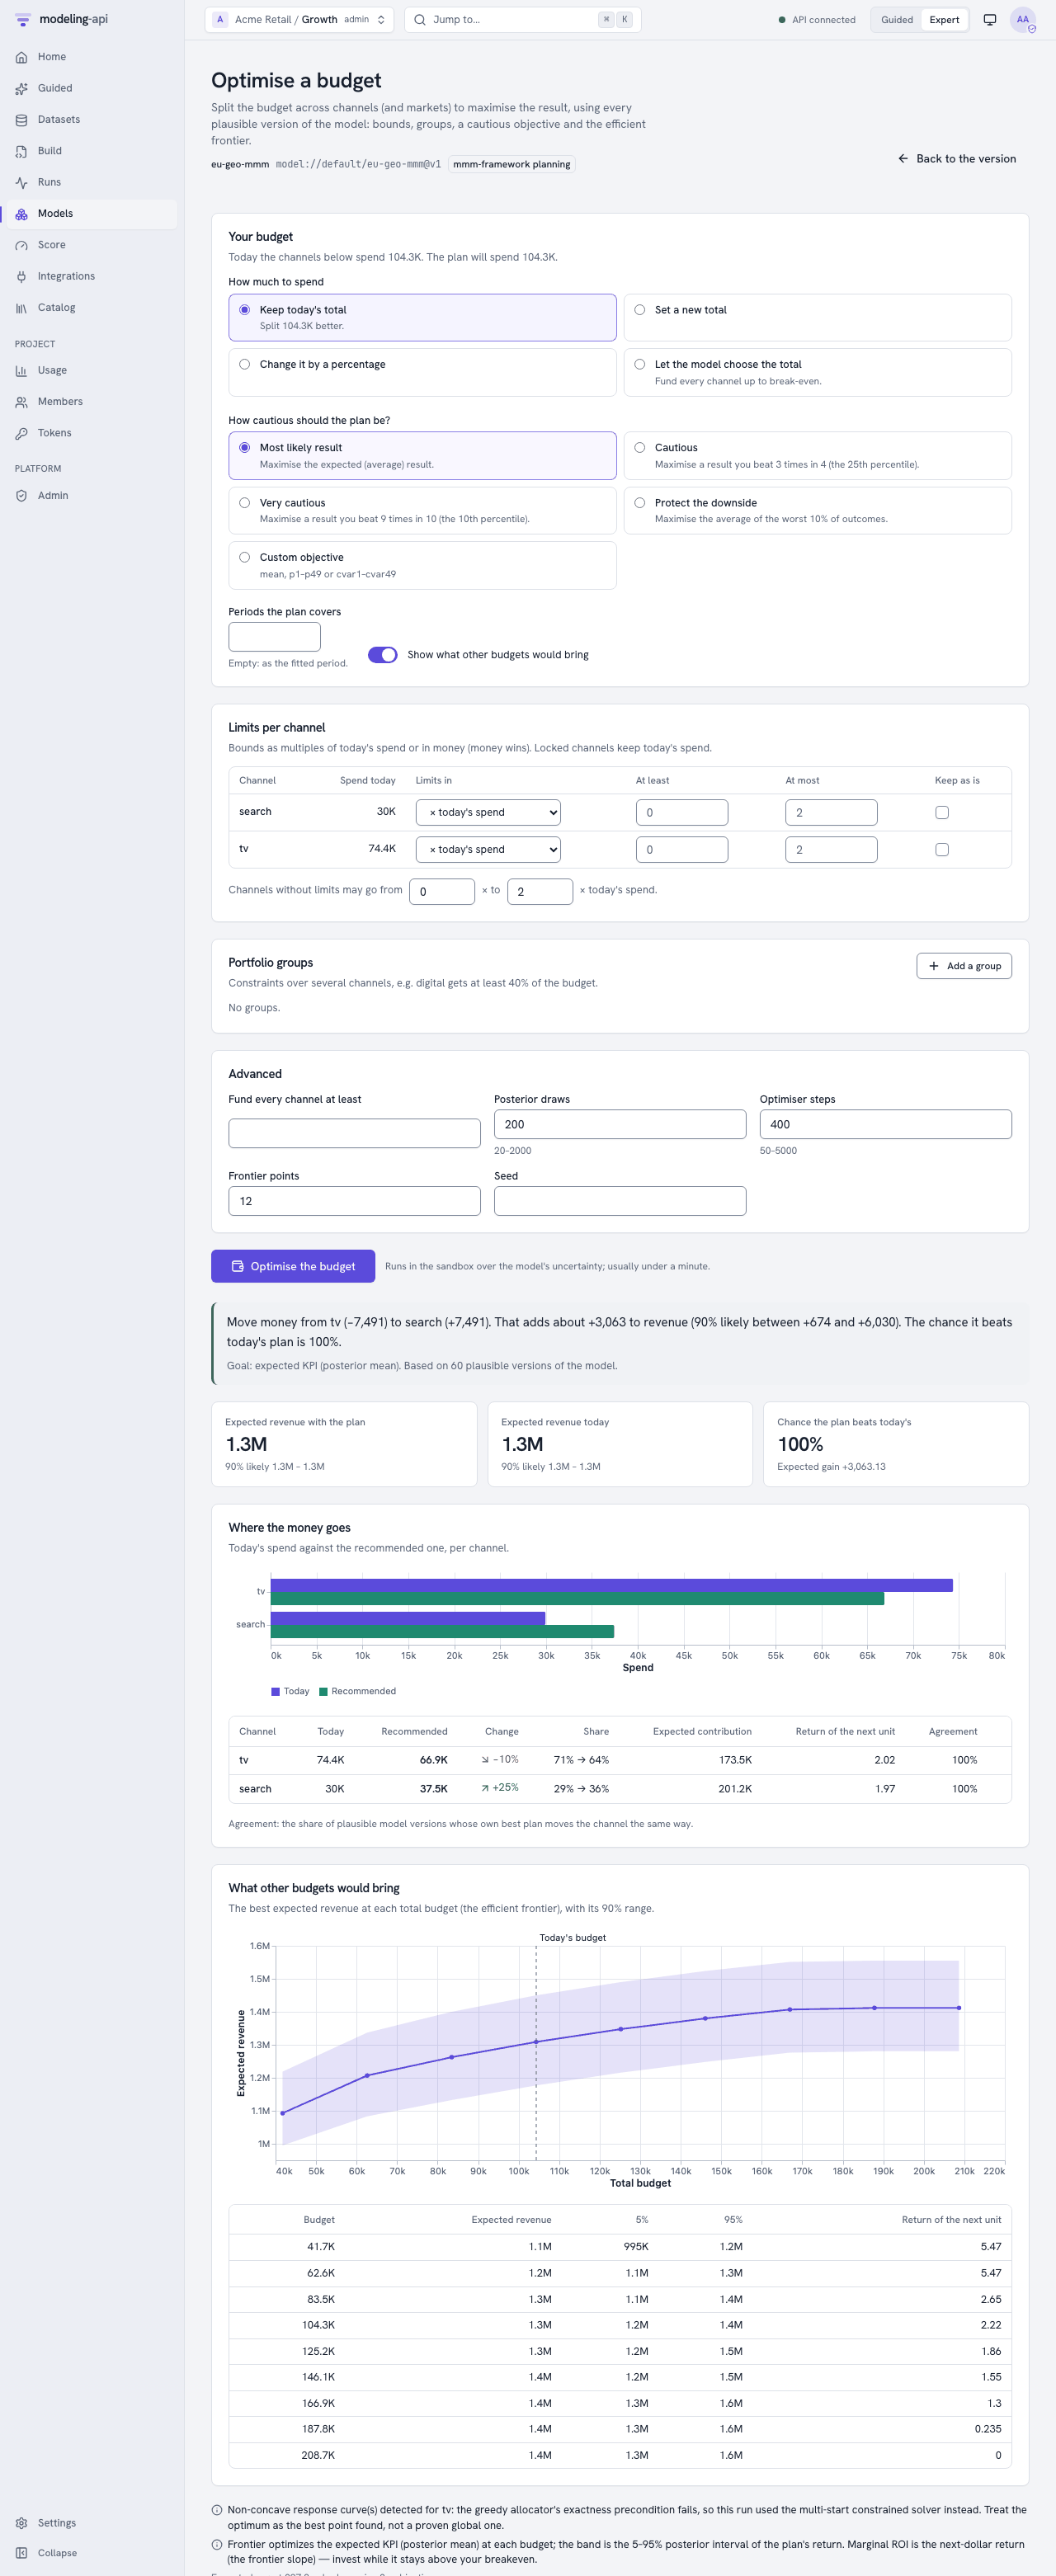
mmm.bayesianpools over geos and products.mmm.frequentistfits in seconds. You get business priors and lift tests. The platform optimises budgets from the posterior with risk objectives. -
Twelve statsmodels models
The models go from SARIMAX to VECM and Markov switching. They have future drivers, prediction intervals, impulse responses and cointegration tests.
-
About cards and Help me choose
Each model, step, node, check and template explains itself in plain words. Eight questions give a ranked shortlist with reasons. Use the web app,
mapi chooseorapi.catalog.recommend().
See it at work
What came in v0.4
-
Guided mode
Guided mode has four templates (geo marketing mix, weekly forecast, demand by store, customer choice). It finds the roles of columns and has MFF and Meridian presets. You can open drafts as YAML. A lock can keep a project in Guided mode only.
-
Business priors and lift tests
A sandbox translates ROI or contribution-share ranges into model priors. A prior-predictive preview shows the result. Experiments go into the likelihood as calibration.
-
Sanity scorecard and promotion gate
The scorecard has checks for convergence, holdout error and coverage, plausibility and data. Each check is in plain words. A pass goes live. A warn needs an audited reason from an admin. The gate blocks a fail.
-
What-if, forecasts, counterfactuals
The sliders use response curves that the platform calculates before, for each posterior draw. Thus the bands stay joint and honest. "Run exact" scores the full model with common random numbers.
-
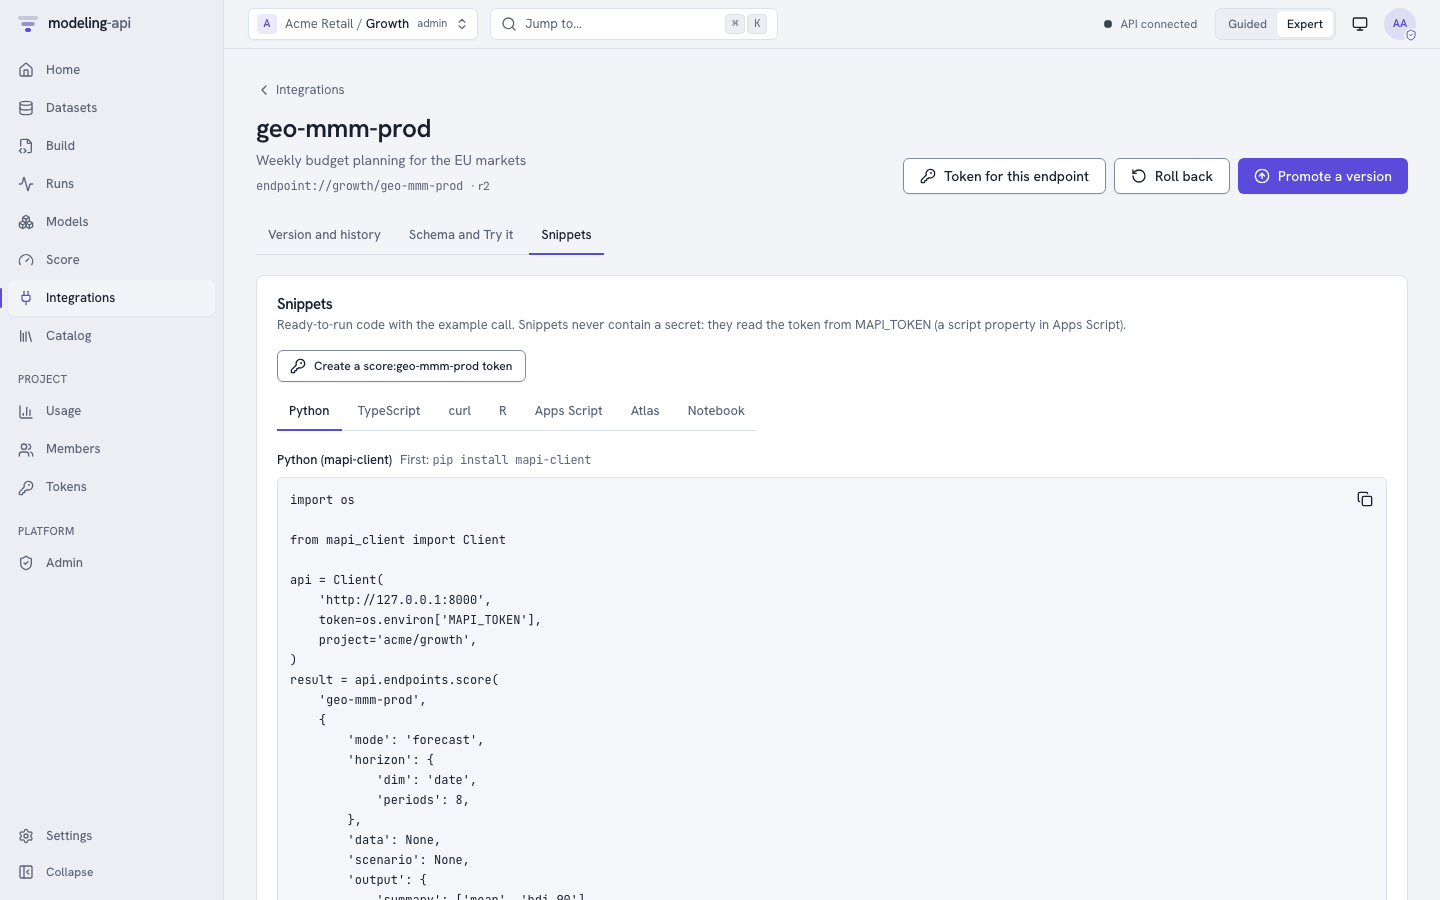
Endpoints, aliases and snippets
Each use gets a stable alias, with history and rollback. Each endpoint has a frozen input contract with an example call, and
score:<alias>tokens. The platform makes code in seven flavours. -
Signed webhooks
The events are
run.*,model.version.ready,endpoint.promotedandscore.completed. They are HMAC-signed and go through an SSRF guard. The platform tries them again if they fail, logs them, and can send them again. -
Embeds and static renders
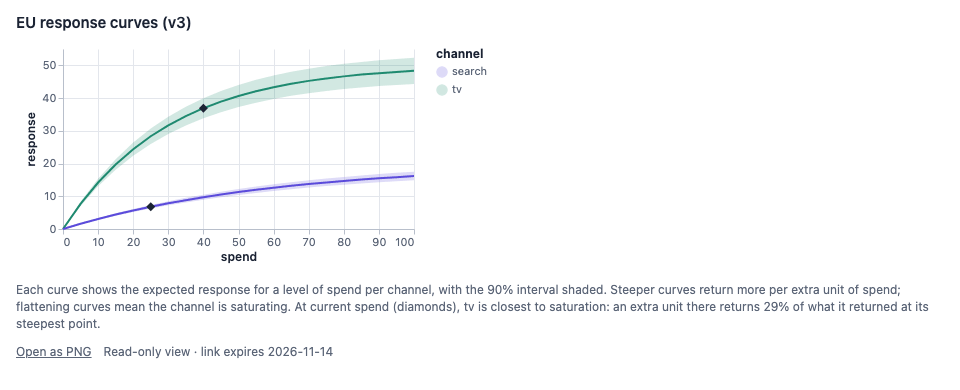
Chart links are read-only and expire. Use them in Notion, Slack, Looker Studio or Power BI. The sandbox also renders PNG, SVG or PDF files.
-
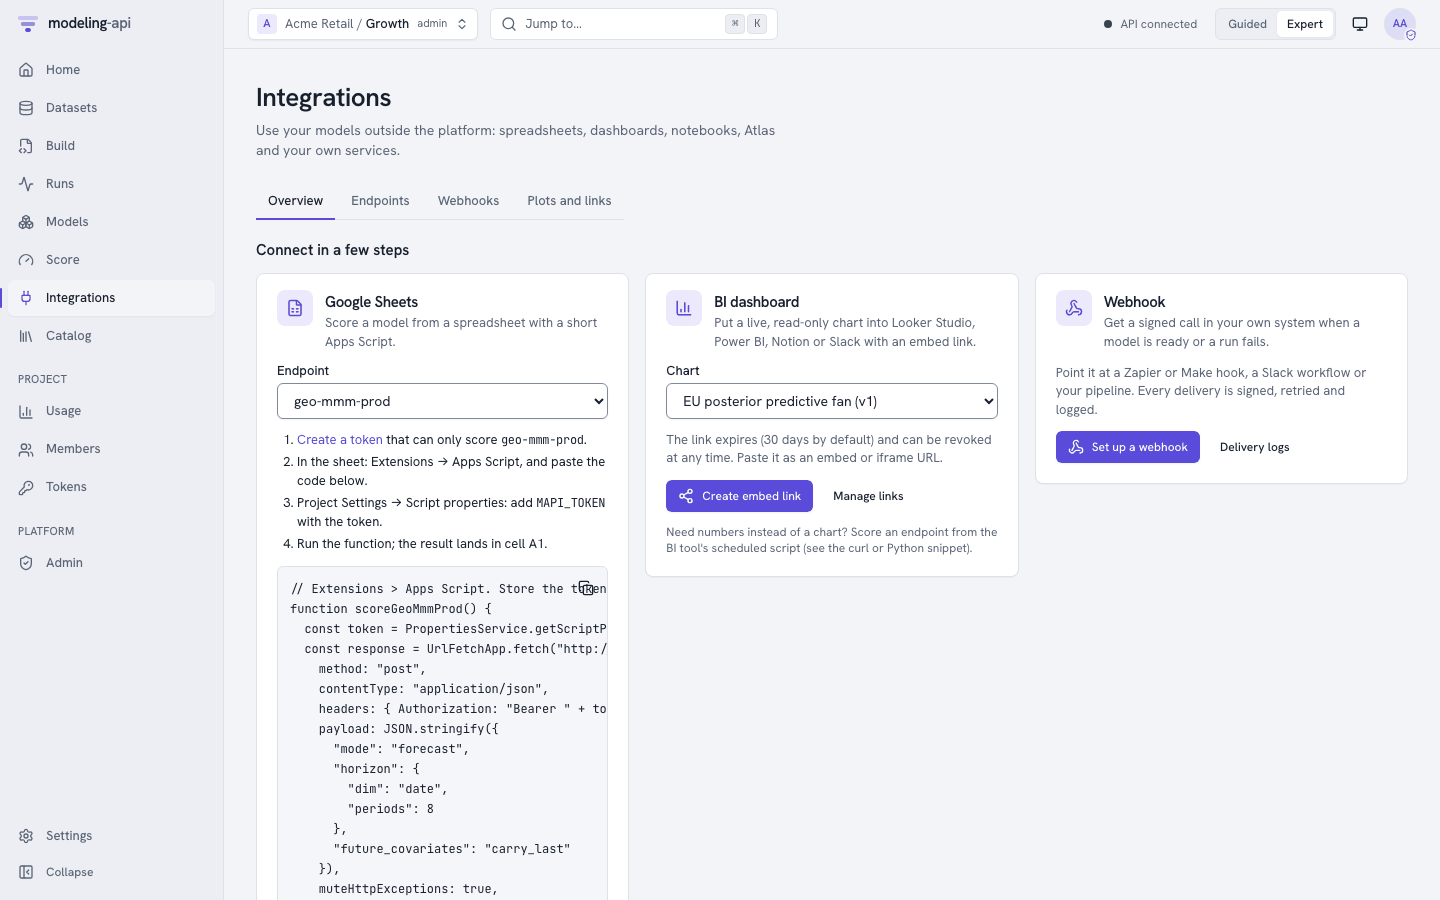
Google Sheets
A card on each endpoint makes an Apps Script. The script writes a forecast into a sheet each morning. Its token has a scope of that one endpoint only.
-
Sign-up and the data lifecycle
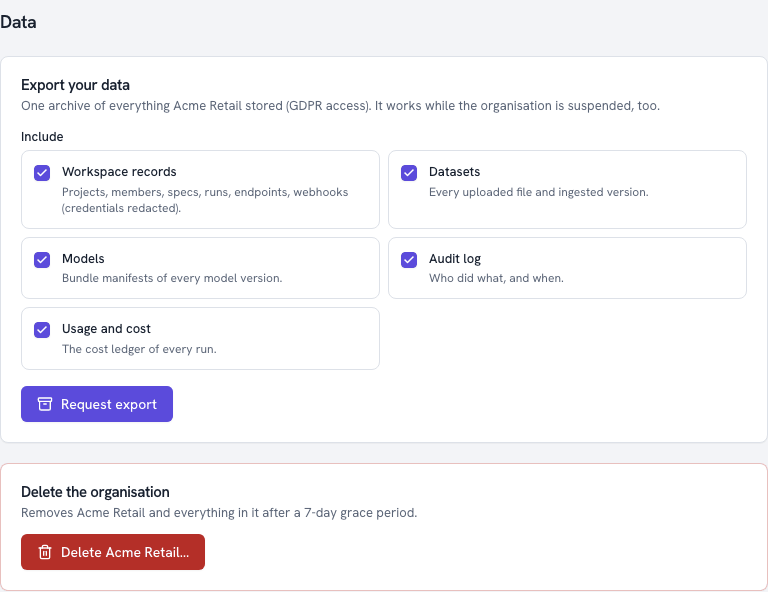
Users can make their own workspaces, with e-mail verification and abuse controls. There is a GDPR export and a tenant deletion that purges all stores. There is also a Cloud Armor policy.
-
A customer-choice model
choice.multinomial_logitis a conditional logit with household effects. It has categorical holdout metrics: the log score, Brier, and the hit rate compared with a guess of the favourite each time. -
Client and CLI for all of it
api.endpoint("…").score(ds)returns anxarray.Dataset. From a terminal,mapi endpoints,webhooks,plots,guided,priorsandtenantdo the other tasks.
Measured, not promised
The v0.9 values come from fits of the real data of the pymc-challenges notebooks. We got the first two values in the web app on a local dev stack, with the sandboxed runner (E18 tutorial):
We measured the values below on an 8-core laptop against the full stack. The fits were real fits in the sandboxed runner. The v0.5 journeys used the data and settings of M3.5 verification:
These runs found eight defects that unit, integration and mocked-browser tests did not find. We repaired each defect and added a regression test before the release. The v0.4 journey used the data of M3 verification:
We did not measure these items yet: real testers, a real Google Cloud project and public workspaces with Docker isolation (what remains).
Connect it to everything
geo_mmm = api.endpoint("geo-mmm-prod")
schema = geo_mmm.schema()
print(sorted(schema.snapshot.input_schema.vars))

plan = xr.Dataset(
    {"spend_local": (("market", "channel", "date"), np.array([[[1200.0], [5300.0]]]))},
    coords={"market": ["de"], "channel": ["search", "tv"], "date": ["2025-12-30"]},
)
result = geo_mmm.score(plan, wait=60)  # inline XrJSON in, xr.Dataset out
print(result["revenue_local"].sel(stat="mean").values)
Tutorials · Use cases · The Python client
The core idea: fit with preprocessing, score with the same preprocessing
The same pipeline object runs at fit time and at score time. At fit time, each step learns its state from the training data. At score time, it replays that state. Steps that look back in time store a small tail for each group. Thus a forecast sees exactly the history that the model used for the fit.
flowchart LR
    subgraph FIT["Fit (once)"]
        direction LR
        A["Daily spend & revenue<br/>local currency"] --> B["fx_convert<br/>(side table)"]
        B --> C["resample<br/>daily → weekly"]
        C --> S{{"split<br/>last 8 weeks"}}
        S --> D["holidays<br/><i>pinned side table</i>"]
        D --> M["model.fit<br/><i>keeps the fitted history<br/>for carry-over</i>"]
    end
    M --> BUN[("Bundle<br/>states · context tails · posterior<br/>hashes · no pickle")]
    subgraph SCORE["Score (any time)"]
        direction LR
        F["Next quarter's plan<br/>or a new market"] --> G["same steps,<br/><b>replayed</b> state"]
        G --> H["model.score"]
        H --> I["inverse → weekly EUR<br/>summaries · your names"]
    end
BUN --> Gpipeline:
- {id: to_eur, use: core.fx_convert@^1, with: {vars: [y, spend], table: fx, ...}}
- {id: weekly, use: core.resample@^1, with: {dim: time, freq: W-SUN, how: sum}}
- {id: hols, use: core.holidays@^1, with: {table: holidays, along: time}}
model:
use: mmm.bayesian@^1 # mmm-framework: scaling and carry-over inside
settings: {hierarchy: {pool_over: [geo]}, new_levels: hyperprior}
fit: {mode: evaluate_then_refit}
- The platform checks the full spec statically. It checks names, dims, settings and
units at each stage. It also checks where the split occurs, and if a step can learn
from the holdout (
LEAKAGE_RISK). - It fits each stateful step on the training weeks only, and then fits the model. Then it scores the holdout through the same path that a forecast uses and records the metrics.
- It fits again on all weeks, so that forecasts start from the latest data. Then it writes a bundle with each state, context tail and hash.
- Forecasts in weekly EUR, not in "model units". The model reports its own units. The
units stop at the weekly resample, because you cannot get daily values back from weekly
sums. The
output_space(model-owned) andunitsattributes of the output tell this. - A new market that comes from the fitted hyperprior. Its range is honestly wider than the range of a known market.
- What-if deltas that share their noise with the baseline (common random numbers). Thus the delta shows the change, not the sampling noise.
This is the same model in plain Python, without a server. The test suite runs each snippet on this site:
from mapi_sdk import fit_spec

bundle = fit_spec(spec, data, registry=registry, raw_schema=schema)
print(bundle.metrics.values)  # holdout metrics, in units sold: {'rmse': ..., 'mape': ..., ...}
print(bundle.metrics.n_holdout)  # 48 cells: 3 stores x 2 skus x 8 weeks
from mapi_spec import ErrorCode, MapiError


def try_score(request_yaml: str, payload: xr.Dataset) -> ErrorCode:
    try:
        score_bundle(bundle, request_yaml, payload, registry=registry)
    except MapiError as err:
        print(err.code, "-", err)
        return err.code
    raise AssertionError("expected a typed error")


FORECAST = """
apiVersion: mapi/v1
kind: ScoreRequest
model: endpoint://quickstart/fruit-demand
mode: forecast
horizon: {dim: time, periods: 4}
"""

# 1. a forecast without next month's promotions: promo is future_required
code_1 = try_score(FORECAST, plan.drop_vars("promo"))

# 2. quantiles are per cell, so "total over all stores" would be a made-up number
code_2 = try_score(FORECAST + "output: {aggregate: {over: [store]}}\n", plan)

# 3. a product outside the fitted range: sku is a fixed dim
code_3 = try_score(FORECAST, plan.assign_coords(sku=["apples", "kiwis"]))
Secure by design
The platform can run models and data from persons that it does not trust. The most important controls are not settings that you can forget to set. They are part of how the platform works. The security model tells what each control stops. It also tells what we must still verify in the cloud.
-
A fresh sandbox per run
Each ingest, fit, score and render runs in its own sandbox (a microVM on Cloud Run Jobs). The sandbox has no secrets. Its only network access is signed URLs to its own objects. The code enforces the placement by trust tier.
-
Tenants never see each other
Each table has PostgreSQL row-level security. It is pinned for each transaction, and it fails closed. The platform checks roles at each request. Operators manage the platform, but they do not read tenant data.
-
Outputs are claims
The platform compares the outputs of a run with the hashes and generations of the store. Then it copies the outputs to a location where runs cannot write, and signs them. It makes download links only after it verifies the signature.
-
Integrations that cannot be turned against you
Webhooks are HMAC-signed. They go through an SSRF guard that pins the checked address. Embed links show only platform recipes and have no credential. You can revoke them. Snippets never contain a secret.
-
Compute you can see and cap
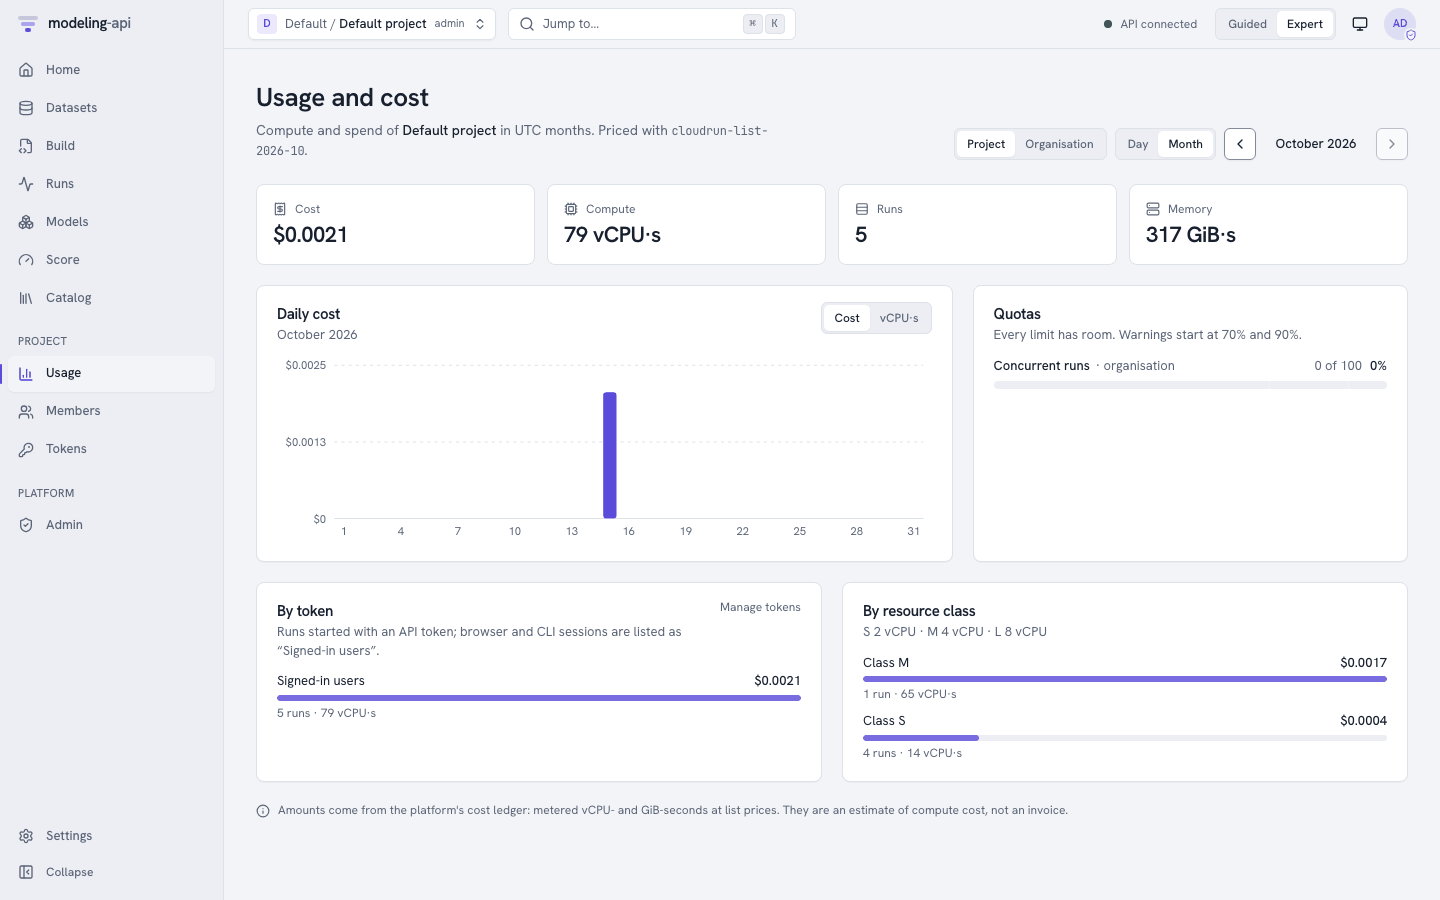
Quotas are in vCPU-seconds for each token, tenant and platform. Each token that calls an endpoint has a budget. Each run shows a cost. There is a global spend cap and an audited kill switch.
-
No pickle, anywhere
Bundles are single zarr zips plus JSON sidecars. Native models are skops (allow-listed types) or xgboost JSON. Network weights are safetensors files. Each file has CRC32C, MD5 and SHA-256 values. The platform verifies them when it reads the file.
Run it for many teams
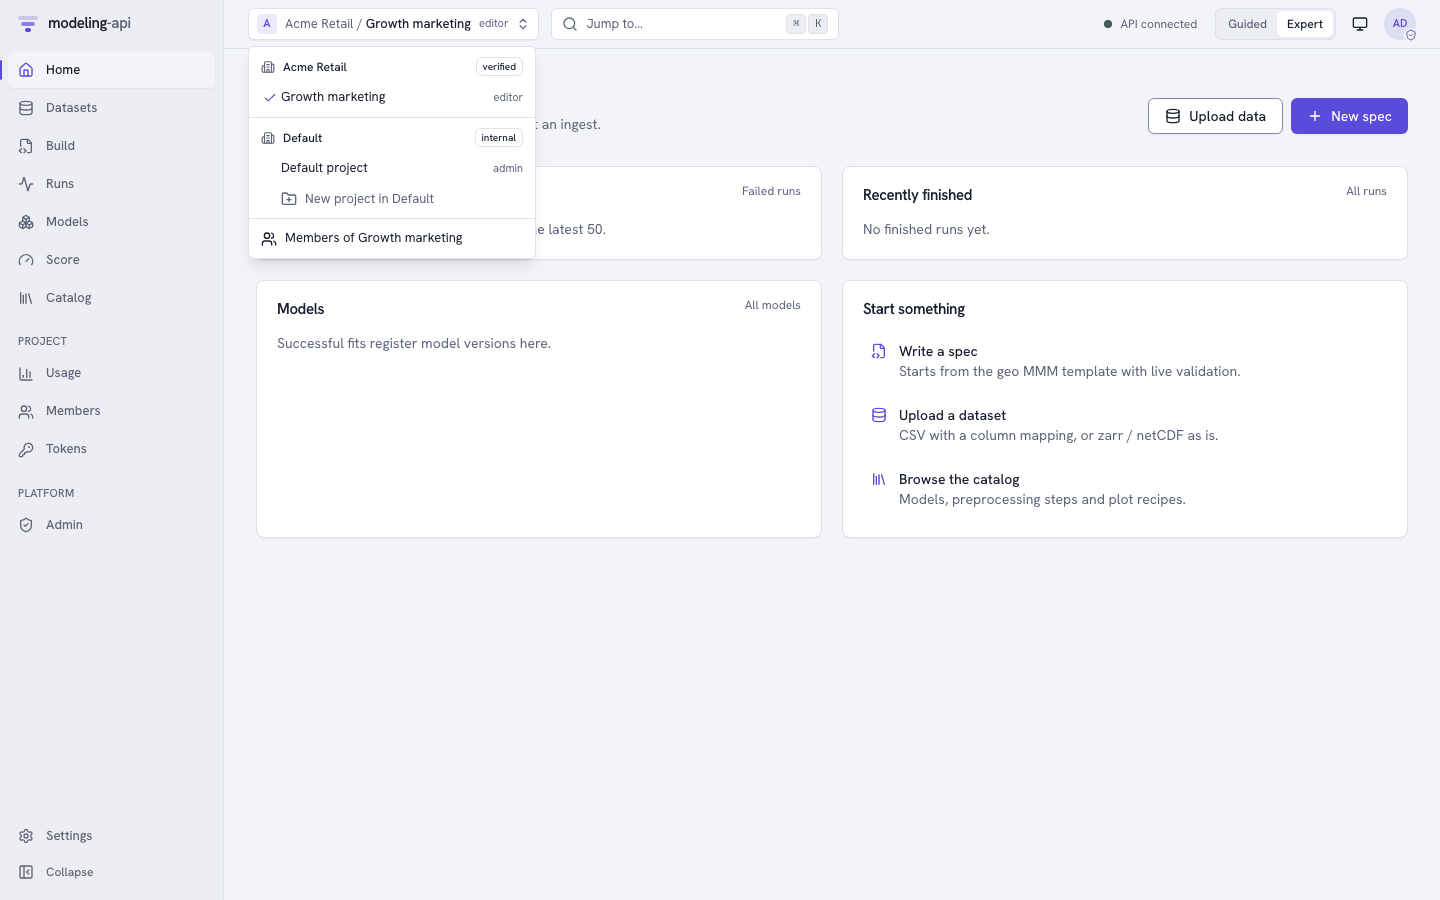
One deployment serves many organisations. Users sign up, or sign in with their own identity provider. They work in the projects where they have a role, and they see the cost of their compute. Operators manage the platform, but they never read the data of a tenant.
Administration · Deploy on your laptop or Google Cloud · Roadmap: what comes next