Embed a chart in Notion, Slack or BI v0.4
Put the chart of a fitted model where people make decisions. Examples are the page for plans in Notion, the weekly thread in Slack, and the dashboard in Looker Studio or Power BI. An embed link shows one chart, read-only, to all persons who have the link. It works until it expires or until you revoke it. No person needs an account, and the link can read nothing else.
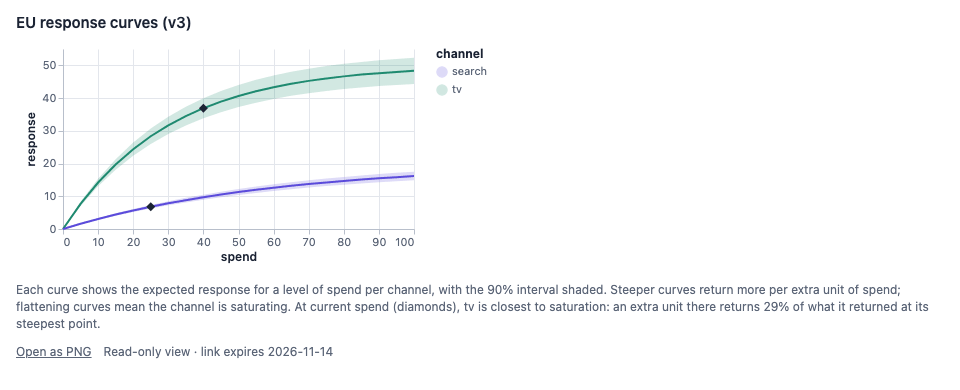
The link opens this page. It shows the chart, its caption in plain language, a PNG fallback and the expiry date.
What can be shared
You can share only charts that the platform drew with one of its own recipes (core.*,
mmm.*, ml.*, ts.*, choice.* and, from v0.13, causal.*). Examples are response
curves, decompositions, forecast fans, scorecard charts and the effect of a campaign. The platform refuses a chart that a plugin or a person wrote
(EMBED_NOT_ALLOWED). The reason is that a shared link runs the specification of the chart
in the browser of an unknown person. Only specifications that the platform wrote can do
that. Share the other charts inside the project, or as a PNG.
A link points at one model version. Thus the chart does not change for your readers when the model is fitted again. If you want them to see the new version, share the chart of the new version.
1. Create the link
- On the last step, Share, select Share a chart.
- Select the chart.
- Create the link.
- Go to Integrations → Plots and links → Save a model plot. Alternatively, use Share in the plot gallery of a model version.
- Select the model, the version and the chart.
- On the saved plot, click Create link.
- Optionally, give it a label, an expiry and the sites that can frame it. The expiry is 7 to 365 days. The default is 30 days.
saved = api.plots.save(
    "EU response curves (v3)",
    model_id="mdl_01jaf3c1d2e3f4g5h6j7k8m9n0",  # the model version that drew the plot
    version=3,
    plot_id="mmm.response_curves",  # one of its plots: a platform recipe
)
print(saved.id, "embeddable" if saved.embeddable else "not embeddable")
link = api.plots.create_embed(
    saved.id,
    label="Weekly marketing review",
    expires_in_days=90,
    allowed_origins=["https://lookerstudio.google.com"],  # leave out: any site may frame it
)
print(link.url)  # shown once: paste it into the tool now
iframe = (f'<iframe src="{link.url}" width="900" height="520" style="border:0" '
          f'loading="lazy" title="{saved.title}"></iframe>')  # fmt: skip
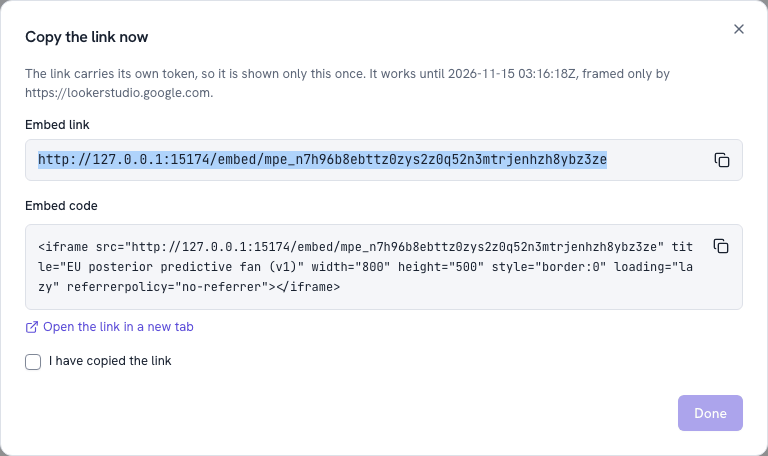
The platform shows the link and its <iframe> code one time only. It keeps only a keyed
hash of the token, as for a password. Copy the link now.
2. Put it where people look
| Tool | How | Notes |
|---|---|---|
| Notion | Type /embed, then paste the link. |
Keep sites that may frame it empty, unless you know which origin frames the embed (see below). |
| Slack | Paste the link in a message or a canvas. | Slack shows links, not live frames. Readers click the link to see the chart. For an image in the thread, post the PNG (step 4). |
| Looker Studio | Use Insert → URL embed, then paste the link. | If you restrict sites, permit https://lookerstudio.google.com. |
| Power BI | On a dashboard, use Add a tile → Web content. Then paste the <iframe> code. |
Reports have no built-in web frame. Use a custom visual that renders HTML, or use the PNG. |
| Confluence, internal portals, any web page | Paste the <iframe> code. In Confluence, use an iframe or HTML macro. |
Set width and height to fit the page. |
| Slides, PDFs, e-mail | Use the PNG (step 4). | These cannot show live content. |
Sites that may frame it. You can give a list of https:// origins. Then the embed page
draws the chart only when the page that directly frames it is in the list. On other pages,
it shows This plot can only be shown on the sites it was shared with. If you open the link
directly, it always works. Some tools frame embeds through their own embed service. Then
the check sees the origin of that service. If the notice shows, add the origin that the
developer tools of your browser show as the parent of the frame. Alternatively, create the
link without a restriction.
3. Check it
Open the link in a private window. You do not sign in, and you see one chart. From Python, you can get the same public view that the embed page reads. You can also get the list of the links of the plot, with their view counts:
view = api.plots.embed(link.token)  # what the link shows, fetched without credentials
print(view.title, "| expires", view.expires_at.date(), "|", view.plot.provenance.recipe)
for embed in api.plots.embeds(saved.id):
    print(embed.display, embed.label, embed.status, embed.views, "views")
EU response curves (v3) | expires 2026-11-14 | mmm.response_curves@1.0.0
mpe_7k2m9q… Weekly marketing review active 0 views
The list does not show a token again. It shows only the first characters of the token
(display).
4. A PNG, SVG or PDF instead
For slides, a PDF report or a Slack thread, render the chart to a file. The render is a
small sandboxed run (the runner role). When you download the file, the platform checks it
against its checksum:
render = api.plots.render(saved_plot_id=saved.id, format="png", width=1200, height=600)
png = api.plots.download_render(render, Path("eu-response-curves.png"))  # CRC32C-checked
In the hub, the Download buttons of a saved plot do the same thing. On the command line,
use mapi plots render --saved plt_… -f pdf -o chart.pdf. When you create a link with the
runner role, the platform also renders a PNG. The embed page shows it as Open as PNG
for tools that cannot show interactive content.
5. Revoke it
Revoke the link when the meeting is complete. Also revoke it if the link went to a location where it must not be:
In the hub, click Revoke in the list of links of the plot. On the command line, use
mapi plots revoke <plot_id> <embed_id>. Each dashboard that shows the link stops when it
loads again. It shows This link has expired or was revoked. If you delete the saved plot,
the platform revokes all of its links. If you delete the organisation, the platform revokes
all links at the same time.
What a viewer's browser can and cannot do
The embed page comes from the origin of the plot sandbox, not from the origin of the app. It sends no cookie or credential. Its Content-Security-Policy lets it get the one public embed view and nothing else. The browser validates the view again, and the page writes each text as text. The view carries the data of the chart inline (up to 1.5 MB). Thus the page never touches storage. Rate limits for each link and for each address stop persons who try to scrape a link (Sharing plots).
Next
- Connect Google Sheets to get the numbers behind the chart.
- Sharing plots gives all the options to save, render and
embed, with
curl.