Connect Google Sheets v0.4
At the end of this tutorial, a Google Sheet holds the forecast of your model, week by week. It shows the actual results that the model was fitted on, and the range of possible future values. The sheet refreshes itself each morning. No person needs to open the platform. The sheet holds only a token that can score one endpoint.
| You need | Where to get it |
|---|---|
| An endpoint that serves a model that forecasts (a geo marketing mix or a weekly forecast) | The Guided Share step, or Promote a model in the Integrations hub |
| A platform that the internet can get to | Apps Script runs on the servers of Google. Thus it cannot call a stack on 127.0.0.1. Use the deployment of your team. |
| A Google account that can use Apps Script | Any Google Workspace account or personal account |
1. Create a token that can only score this endpoint
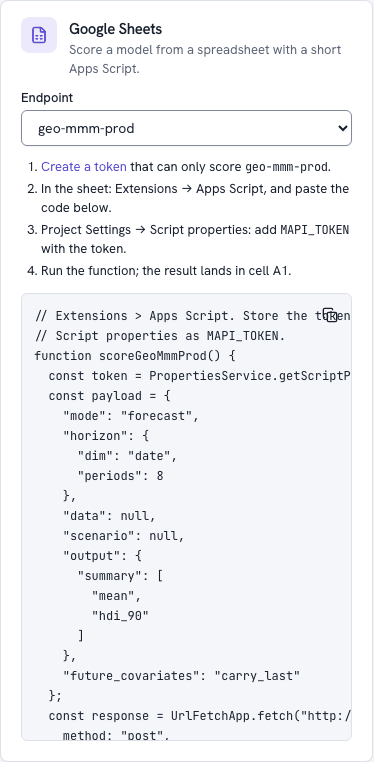
- In the web app, open Integrations. The Google Sheets card lists your endpoints.
- Select your endpoint.
- Click Create a token. The Tokens page opens with the data for a
score:<alias>token. This token can read and score that endpoint and nothing else.
Alternatively, use a terminal. This command also sets a rate limit and a monthly compute budget:
The platform shows the secret one time only. All persons who can edit the script can see
the script properties of a sheet. For this reason, the token must be able to do only one
thing: score this endpoint. You can revoke the token at any time on the Tokens page
(mapi tokens revoke).
2. Paste the generated script
- In the sheet, select Extensions → Apps Script.
-
Replace the empty function with the code from the card. This code is the Apps Script snippet of the endpoint. It is also on the Snippets tab of the endpoint, and you can get it with
mapi endpoints snippets geo-mmm-prod -l apps_script. For an endpointgeo-mmm-prod, the code is similar to this:// Extensions > Apps Script. Store the token once under Project Settings > // Script properties as MAPI_TOKEN. // // Input (optional): a sheet named "Input" in long format - a header row naming the // endpoint's dims and input variables, then one row per coordinate - replaces the // example's inline data. // The answer's summary (per coordinate) is written to a sheet named "Result", under a note // on what a forecast was conditioned on. function scoreGeoMmmProd() { const token = PropertiesService.getScriptProperties().getProperty("MAPI_TOKEN"); const payload = { "future_covariates": "carry_last", "horizon": { "dim": "time", "periods": 8 }, "mode": "forecast", "output": { "kind": "expected", "summary": [ "mean", "hdi_90" ] } }; const inputs = null; const book = SpreadsheetApp.getActiveSpreadsheet(); const input = book.getSheetByName("Input"); if (input) { const key = payload.scenario && payload.scenario.data_vars ? "scenario" : "data"; const zone = book.getSpreadsheetTimeZone ? book.getSpreadsheetTimeZone() : Session.getScriptTimeZone(); const sent = mapiSheetToXr_(input.getDataRange().getValues(), payload[key], inputs, zone); const noRows = Object.values(sent.coords).every((c) => !c.data.length); if (key === "data" && payload.mode === "forecast" && payload.horizon) { // no row left: forecast the horizon's periods after the fitted history payload.data = noRows ? null : sent; if (!noRows) payload.horizon.periods = mapiForecastPeriods_(payload, payload.horizon.periods); } else { payload[key] = sent; } } const response = UrlFetchApp.fetch("https://api.mapi.example/v1/endpoints/geo-mmm-prod/score", { method: "post", contentType: "application/json", headers: { Authorization: "Bearer " + token, "X-Mapi-Project": "acme/growth", Prefer: "wait=60", }, payload: JSON.stringify(payload), muteHttpExceptions: true, }); const out = book.getSheetByName("Result") || book.insertSheet("Result"); if (response.getResponseCode() >= 300) { const problem = mapiProblemRows_(response.getContentText()); if (problem.length) { out.clear(); out.getRange(1, 1, problem.length, 1).setValues(problem); } throw new Error(response.getResponseCode() + ": " + response.getContentText()); } const result = JSON.parse(response.getContentText()); out.clear(); if (!result.done) { const note = "Still running (" + result.run.id + "): run the function again in a minute."; out.getRange(1, 1).setValue(note); return result; } const tables = mapiSummaryRows_(result.summary); if (!tables.length) { const why = result.run.problem ? mapiProblemRows_(JSON.stringify(result.run.problem)) : []; const rows = [[result.run.state + ": no summary in the answer"]].concat(why); out.getRange(1, 1, rows.length, 1).setValues(rows); return result; } const conditioning = result.summary.conditioning; const rows = conditioning ? [[conditioning.message], [""]].concat(tables) : tables; const width = Math.max(...rows.map((r) => r.length)); const grid = rows.map((r) => r.concat(new Array(width - r.length).fill(""))); out.getRange(1, 1, grid.length, width).setValues(grid); return result; } // The summary tables one below the other: a header row ("variable", the coordinate // columns, the statistics), one row per coordinate, a blank row between tables. function mapiSummaryRows_(summary) { const rows = []; for (const table of (summary && summary.tables) || []) { if (rows.length) rows.push([""]); rows.push(["variable"].concat(table.columns)); for (const row of table.rows) { rows.push([table.variable].concat(row.map((c) => (c === null ? "" : c)))); } } if (summary && summary.truncated) { rows.push(["(truncated: the full result is in the run's outputs)"]); } return rows; } // A problem answer (or a failed run's problem) as rows: what went wrong, what to do. function mapiProblemRows_(text) { let problem; try { problem = JSON.parse(text); } catch (e) { return []; } if (!problem || !problem.code) return []; const first = (problem.errors && problem.errors[0]) || {}; const rows = [[problem.code + ": " + (first.message || problem.detail || problem.title)]]; if (first.suggested_action) rows.push(["What to do: " + first.suggested_action]); return rows; } // A long table (a header row, then rows) as an inline dataset: columns named like a dim // hold coordinates, columns named like an input variable (`inputs`, else the example's // variables) hold values (headers are matched trimmed and ignoring case); empty cells // become null - in a forecast an empty target is a period to forecast - and numbers stored // as text are numbers. Dates are sent as yyyy-MM-dd. function mapiSheetToXr_(values, example, inputs, zone) { let vars = inputs; if (!vars && example && example.data_vars) { vars = {}; for (const [name, spec] of Object.entries(example.data_vars)) vars[name] = spec.dims; } if (!vars) throw new Error("this endpoint's example call sends no inline data to replace"); const norm = (h) => String(h).trim().toLowerCase(); const header = values[0].map(norm); const rows = values.slice(1).filter((r) => r.some((c) => String(c).trim() !== "")); const used = Object.keys(vars).filter((name) => header.indexOf(norm(name)) >= 0); if (!used.length) { throw new Error("the Input sheet needs a column named one of: " + Object.keys(vars).join(", ")); } const targets = []; const dims = [...new Set(Object.values(vars).flat())]; const known = new Set(Object.keys(vars).concat(dims).map(norm)); const unknown = values[0].filter((h) => norm(h) !== "" && !known.has(norm(h))); if (targets.length && !targets.some((t) => used.indexOf(t) >= 0) && unknown.length) { throw new Error( "the Input sheet has no column for " + targets.join(", ") + " (the actuals) but has " + unknown.map((h) => '"' + String(h).trim() + '"').join(", ") + "; the columns are: " + dims.concat(Object.keys(vars)).join(", ") ); } const column = (name) => { const i = header.indexOf(norm(name)); if (i < 0) throw new Error('the Input sheet needs a column named "' + name + '"'); return i; }; const cell = (v) => (v instanceof Date ? Utilities.formatDate(v, zone, "yyyy-MM-dd") : v); const number = (v) => { if (typeof v !== "string") return cell(v); const text = v.trim(); if (text === "") return null; if (/^[-+]?\d{1,3}(,\d{3})+(\.\d+)?$/.test(text)) return Number(text.replace(/,/g, "")); return /^[-+]?(\d+(\.\d*)?|\.\d+)([eE][-+]?\d+)?$/.test(text) ? Number(text) : text; }; const coords = {}; const index = {}; for (const name of used) { for (const dim of vars[name]) { if (index[dim]) continue; const i = column(dim); index[dim] = new Map(); const seen = []; rows.forEach((r, k) => { const key = cell(r[i]); if (key === "") { throw new Error("row " + (k + 2) + ' of the Input sheet has no "' + dim + '"'); } if (!index[dim].has(key)) { index[dim].set(key, seen.length); seen.push(key); } }); coords[dim] = { dims: [dim], data: seen }; } } const data_vars = {}; for (const name of used) { const dims = vars[name]; const i = column(name); const value = (r) => (r[i] === "" ? null : number(r[i])); if (!dims.length) { data_vars[name] = { dims: [], data: rows.length ? value(rows[0]) : null }; continue; } const last = dims.length - 1; const empty = (k) => coords[dims[k]].data.map(() => (k < last ? empty(k + 1) : null)); const data = empty(0); for (const r of rows) { const v = value(r); if (v === null) continue; const at = dims.map((dim) => index[dim].get(cell(r[column(dim)]))); let node = data; for (let k = 0; k < last; k++) node = node[at[k]]; if (node[at[last]] !== null && node[at[last]] !== v) { throw new Error('"' + name + '" has two different values at one row of the Input sheet'); } node[at[last]] = v; } data_vars[name] = { dims: dims, data: data }; } return { coords: coords, data_vars: data_vars }; } // The periods to forecast: the rows after the last one with a target value (every row // when none has one); the horizon's own periods when the sheet ends with an actual. function mapiForecastPeriods_(payload, fallback) { const dim = payload.horizon.dim; const labels = payload.data.coords[dim] ? payload.data.coords[dim].data : []; const filled = new Set(); for (const name of []) { const spec = payload.data.data_vars[name]; if (!spec) continue; const axis = spec.dims.indexOf(dim); const walk = (node, depth, at) => { if (depth === spec.dims.length) { if (node !== null) filled.add(at); return; } node.forEach((child, k) => walk(child, depth + 1, depth === axis ? k : at)); }; if (axis >= 0) walk(spec.data, 0, -1); } const order = labels.map((_, k) => k).sort((a, b) => (labels[a] < labels[b] ? -1 : 1)); if (!filled.size) return labels.length || fallback; let after = 0; for (let k = order.length - 1; k >= 0 && !filled.has(order[k]); k--) after++; return after || fallback; } -
Select Project Settings → Script properties → Add script property.
- Type the name
MAPI_TOKEN. For the value, paste the token from step 1. - Go back to the editor and select the function.
- Push Run. The first run asks you to authorise the script. The script connects to an external service and edits your spreadsheets.
A sheet with the name Result now holds the answer. The platform ran the example call of
the endpoint (here, an 8-week forecast) in a sandbox. It returned the requested summary
inline, with one table for each output variable. Each table has a header row and one row for
each coordinate. The header row contains variable, the coordinate columns (for example
geo and time), and then mean, hdi_90_lower and hdi_90_upper.
The payload is the example of the endpoint. The platform made it from the input contract of the endpoint, so it is valid without changes. The script waits for one minute. If the run takes longer, Result shows Still running. Then run the function again to get the result.
You can send your own data instead of the example data. To do this, add a sheet with the name Input in long format. The sheet has a header row with the dims and input variables of the endpoint. Then it has one row for each coordinate. The script reads the sheet into the call. This also applies to a forecast endpoint, although its example call sends no data. You use this sheet to add your latest actuals and the dates to forecast (step 5).
Here, the summary is for each coordinate, that is, for each market and week. The next step writes a different table. That table shows the history that the model was fitted on, next to the range of the forecast. The values are totals over all markets.
3. Write the forecast into a table
A forecast run also writes a small JSON table for Guided mode, ui/guided/forecast.json.
The table holds the history that the model was fitted on. Then it holds the quantiles of the
forecast for each period. This script gets the table and writes it into a sheet with the
name Forecast.
-
Replace the code with this script:
// A forecast from a modeling-api endpoint, written into the sheet "Forecast": the weeks the // model was fitted on (with your actual results), then the forecast with its likely range. // Extensions > Apps Script: paste this file. Project Settings > Script properties: add // MAPI_TOKEN (a token that can only score this endpoint). const MAPI_URL = "https://api.mapi.example"; // your platform's API address const MAPI_PROJECT = "acme/growth"; // <tenant>/<project> const ENDPOINT = "geo-mmm-prod"; // The call: the "payload" of the hub's Apps Script snippet for your endpoint. const CALL = { mode: "forecast", horizon: { dim: "time", periods: 8 }, future_covariates: "carry_last", output: { kind: "expected", summary: ["mean", "hdi_90"] }, }; function refreshForecast() { const token = PropertiesService.getScriptProperties().getProperty("MAPI_TOKEN"); // One score run per day: running this again the same day collects that run's result // instead of starting another (the platform remembers an Idempotency-Key for 24 hours). const day = Utilities.formatDate(new Date(), "UTC", "yyyy-MM-dd"); const response = UrlFetchApp.fetch(`${MAPI_URL}/v1/endpoints/${ENDPOINT}/score`, { method: "post", contentType: "application/json", headers: { Authorization: "Bearer " + token, "X-Mapi-Project": MAPI_PROJECT, Prefer: "wait=30", "Idempotency-Key": `sheets-${ENDPOINT}-${day}`, }, payload: JSON.stringify(CALL), muteHttpExceptions: true, }); if (response.getResponseCode() >= 300 && response.getResponseCode() !== 202) { throw new Error(response.getResponseCode() + ": " + response.getContentText()); } const result = JSON.parse(response.getContentText()); const sheet = forecastSheet(); if (!result.done) { sheet.getRange("A1").setValue(`Still running (${result.run.state}): run this again in a minute.`); return; } if (result.run.state !== "succeeded") { sheet.getRange("A1").setValue(`The forecast failed: ${result.run.state}. See run ${result.run.id}.`); return; } const link = result.outputs.find((o) => o.name === "ui/guided/forecast.json"); if (!link) { sheet.getRange("A1").setValue("This endpoint's model wrote no forecast table."); return; } // A short-lived signed link: fetch it now, never store it. It needs no token. const view = JSON.parse(UrlFetchApp.fetch(link.url).getContentText()); const fan = view.fan; const header = [fan.dim, `Actual ${view.kpi}`].concat( fan.quantiles.map((q) => (q === 0.5 ? "Median" : `${Math.round(q * 100)}%`)), ); const rows = fan.coords.map((coord, j) => [coord, cell(fan.observed && fan.observed[j])].concat(fan.values.map((row) => cell(row[j]))), ); sheet.getRange(1, 1, 1, header.length).setValues([header]); sheet.getRange(2, 1, rows.length, header.length).setValues(rows); const units = view.units ? ` (${view.units})` : ""; sheet .getRange(rows.length + 3, 1, 1, 2) .setValues([[`Forecast from ${view.split_at}`, `${view.kind} ${view.kpi}${units}`]]); } // An empty cell for a missing value (no actuals after the split, no forecast before it). function cell(value) { return value === null || value === undefined ? "" : value; } function forecastSheet() { const book = SpreadsheetApp.getActiveSpreadsheet(); const sheet = book.getSheetByName("Forecast") || book.insertSheet("Forecast"); sheet.clearContents(); return sheet; } -
Set
MAPI_URL,MAPI_PROJECT,ENDPOINTandCALL.CALLis thepayloadof the generated script. - Run
refreshForecast.
The Forecast sheet is then similar to this table. The numbers depend on your model.
| time | Actual revenue | 5% | 25% | Median | 75% | 95% |
|---|---|---|---|---|---|---|
| 2026-09-27 | 101.5 | |||||
| 2026-10-04 | 98.2 | |||||
| 2026-10-11 | 104.9 | |||||
| 2026-10-18 | 88.0 | 96.3 | 101.2 | 106.4 | 114.9 | |
| 2026-10-25 | 85.1 | 94.0 | 99.8 | 105.2 | 115.3 | |
| Forecast from 2026-10-18 | expected revenue (kEUR) |
Read the table as follows. In 90% of plausible futures, the week of 18 October is between the 5% and 95% columns. Half of the plausible futures are between 25% and 75%. The model adds the KPI over its other dims (markets, stores) for each posterior draw. Then it calculates the quantiles. For this reason, these ranges are honest totals and not sums of the ranges for each market. To make a chart from the table, use Insert → Chart. Use a line for the median and the actuals, and an area between 5% and 95%.
The script does these things, for these reasons:
- One run each day. It sends an
Idempotency-Keythat contains the endpoint and the date. The platform keeps a key for 24 hours. If you run the script again on the same day, you get the same run. The platform does not start (and charge for) another run. If you changeCALL, you get a409 IDEMPOTENCY_CONFLICTuntil the next day. To start again, rename the key. - Still running?
Prefer: wait=30waits for a maximum of 30 seconds. A cold start in the cloud can take longer. Then the sheet shows Still running. The next run of the script gets the result. - Short-lived links. The links of the result are signed URLs that expire after 15 minutes. The script gets the table immediately and does not store the link. The link does not need a token.
4. Refresh it every morning
- In the Apps Script editor, select Triggers (the clock icon).
- Select Add Trigger.
- Select the function
refreshForecast. - Select the event source Time-driven and Day timer.
- Select a time of day.
Each morning, the trigger clears the sheet. Then it fills the sheet with a new forecast from the version that the endpoint serves on that day. Thus, when you promote a better model, the sheet updates. You do not have to change the sheet.
5. Add your latest actuals and future dates
The model was fitted one time, but each month gives a new actual. Type the actual into the
sheet, and the next forecast starts from it. The model updates its state with the actuals. It
uses the parameters from the fit and does not fit again. Then it forecasts the dates that you
list (Forecasts with actuals). This works with the
script from step 2. It works for each endpoint that has a model that can condition on
actuals. The Sheets card and mapi endpoints schema tell you if the model can do this. The
statsmodels time-series models can.
Add a sheet with the name Input, with one row for each period. The sheet has these columns:
- The date column.
- The target. Type a value where you have an actual. Keep the cell empty on the dates to forecast.
This example is for the monthly airline endpoint ts-forecast. The model was fitted on
1949-01 to 1960-12, with the target y and no drivers:
| t | y |
|---|---|
| 1961-01-01 | 417 |
| 1961-02-01 | 391 |
| 1961-03-01 | 419 |
| 1961-04-01 | |
| 1961-05-01 |
Run the function. The model updates with January to March 1961, and it forecasts April and May. Result starts with a note in cell A1. The note tells you the data that the forecast used. Then there is an empty row, and then the table:
Forecast updated with 3 actuals (1961-01-01 to 1961-03-01) after the fitted history, which
ends 1960-12-01; the model's parameters were not re-estimated. 2 periods forecast from
1961-04-01 to 1961-05-01.

variable   t            median   q5    q95
y          1961-01-01   …        …     …
…
y          1961-05-01   …        …     …
The rows of the actual months hold one-step-ahead predictions. These are the values that the model would have given in the month before. The empty months hold the forecast.
A model with drivers has a column for each driver. The model needs a driver value on each
row, also on the dates to forecast. This example is for a monthly sales forecast with a
price driver:
| month | sales | price |
|---|---|---|
| 2026-10-01 | 1520.5 | 9.99 |
| 2026-11-01 | 1610.0 | 9.99 |
| 2026-12-01 | 10.49 | |
| 2027-01-01 |
The price of the last month is empty. Thus future_covariates: "carry_last" in the script
uses the latest price that you gave again (10.49). The column names are the names of the
endpoint. You can find them in these locations:
- The Google Sheets card shows the layout of the selected endpoint.
mapi endpoints schema ALIASlists the columns.- The generated script has a second function,
score<Alias>InputSheet. This function creates the Input sheet with the correct header. It also adds the periods after the fit, all empty.
The generated script for the sales-forecast endpoint
// Extensions > Apps Script. Store the token once under Project Settings >
// Script properties as MAPI_TOKEN.
//
// Input (optional): a sheet named "Input" in long format - a header row (month, sales,
// price), then one row per coordinate, dates as yyyy-MM-dd - is sent as the call's data.
// Fill sales with your latest actuals and leave it blank on the dates to forecast: the
// model updates its state with the actuals (it is not refitted) and forecasts the blank
// rows. Driver cells left blank on those dates are carried forward. Run
// scoreSalesForecastInputSheet() once to create the sheet with the periods after the fit.
// The answer's summary (per coordinate) is written to a sheet named "Result", under a note
// on what a forecast was conditioned on.
function scoreSalesForecast() {
  const token = PropertiesService.getScriptProperties().getProperty("MAPI_TOKEN");
  const payload = {
    "mode": "forecast",
    "horizon": {
      "dim": "month",
      "periods": 8
    },
    "data": null,
    "scenario": null,
    "output": {
      "summary": [
        "median",
        "q5",
        "q95"
      ]
    },
    "future_covariates": "carry_last"
  };
  const inputs = {
    "sales": [
      "month"
    ],
    "price": [
      "month"
    ]
  };
  const book = SpreadsheetApp.getActiveSpreadsheet();
  const input = book.getSheetByName("Input");
  if (input) {
    const key = payload.scenario && payload.scenario.data_vars ? "scenario" : "data";
    const zone = book.getSpreadsheetTimeZone
      ? book.getSpreadsheetTimeZone()
      : Session.getScriptTimeZone();
    const sent = mapiSheetToXr_(input.getDataRange().getValues(), payload[key], inputs, zone);
    const noRows = Object.values(sent.coords).every((c) => !c.data.length);
    if (key === "data" && payload.mode === "forecast" && payload.horizon) {
      // no row left: forecast the horizon's periods after the fitted history
      payload.data = noRows ? null : sent;
      if (!noRows) payload.horizon.periods = mapiForecastPeriods_(payload, payload.horizon.periods);
    } else {
      payload[key] = sent;
    }
  }
  const response = UrlFetchApp.fetch("https://api.mapi.example/v1/endpoints/sales-forecast/score", {
    method: "post",
    contentType: "application/json",
    headers: {
      Authorization: "Bearer " + token,
      "X-Mapi-Project": "acme/growth",
      Prefer: "wait=60",
    },
    payload: JSON.stringify(payload),
    muteHttpExceptions: true,
  });
  const out = book.getSheetByName("Result") || book.insertSheet("Result");
  if (response.getResponseCode() >= 300) {
    const problem = mapiProblemRows_(response.getContentText());
    if (problem.length) {
      out.clear();
      out.getRange(1, 1, problem.length, 1).setValues(problem);
    }
    throw new Error(response.getResponseCode() + ": " + response.getContentText());
  }
  const result = JSON.parse(response.getContentText());
  out.clear();
  if (!result.done) {
    const note = "Still running (" + result.run.id + "): run the function again in a minute.";
    out.getRange(1, 1).setValue(note);
    return result;
  }
  const tables = mapiSummaryRows_(result.summary);
  if (!tables.length) {
    const why = result.run.problem ? mapiProblemRows_(JSON.stringify(result.run.problem)) : [];
    const rows = [[result.run.state + ": no summary in the answer"]].concat(why);
    out.getRange(1, 1, rows.length, 1).setValues(rows);
    return result;
  }
  const conditioning = result.summary.conditioning;
  const rows = conditioning ? [[conditioning.message], [""]].concat(tables) : tables;
  const width = Math.max(...rows.map((r) => r.length));
  const grid = rows.map((r) => r.concat(new Array(width - r.length).fill("")));
  out.getRange(1, 1, grid.length, width).setValues(grid);
  return result;
}

// Creates the "Input" sheet: the header row and the periods after the fitted history, every
// value blank. Fill in what you know, then run scoreSalesForecast().
function scoreSalesForecastInputSheet() {
  const book = SpreadsheetApp.getActiveSpreadsheet();
  if (book.getSheetByName("Input")) {
    throw new Error('There is an "Input" sheet already: rename or delete it to start over.');
  }
  const header = ["month", "sales", "price"];
  const rows = [
    ["2026-10-01", "", ""],
    ["2026-11-01", "", ""],
    ["2026-12-01", "", ""],
    ["2027-01-01", "", ""],
    ["2027-02-01", "", ""],
    ["2027-03-01", "", ""],
  ];
  const sheet = book.insertSheet("Input");
  sheet.getRange(1, 1, 1, header.length).setValues([header]);
  if (rows.length) sheet.getRange(2, 1, rows.length, header.length).setValues(rows);
  sheet.setFrozenRows(1);
}

// The summary tables one below the other: a header row ("variable", the coordinate
// columns, the statistics), one row per coordinate, a blank row between tables.
function mapiSummaryRows_(summary) {
  const rows = [];
  for (const table of (summary && summary.tables) || []) {
    if (rows.length) rows.push([""]);
    rows.push(["variable"].concat(table.columns));
    for (const row of table.rows) {
      rows.push([table.variable].concat(row.map((c) => (c === null ? "" : c))));
    }
  }
  if (summary && summary.truncated) {
    rows.push(["(truncated: the full result is in the run's outputs)"]);
  }
  return rows;
}

// A problem answer (or a failed run's problem) as rows: what went wrong, what to do.
function mapiProblemRows_(text) {
  let problem;
  try {
    problem = JSON.parse(text);
  } catch (e) {
    return [];
  }
  if (!problem || !problem.code) return [];
  const first = (problem.errors && problem.errors[0]) || {};
  const rows = [[problem.code + ": " + (first.message || problem.detail || problem.title)]];
  if (first.suggested_action) rows.push(["What to do: " + first.suggested_action]);
  return rows;
}

// A long table (a header row, then rows) as an inline dataset: columns named like a dim
// hold coordinates, columns named like an input variable (`inputs`, else the example's
// variables) hold values (headers are matched trimmed and ignoring case); empty cells
// become null - in a forecast an empty target is a period to forecast - and numbers stored
// as text are numbers. Dates are sent as yyyy-MM-dd.
function mapiSheetToXr_(values, example, inputs, zone) {
  let vars = inputs;
  if (!vars && example && example.data_vars) {
    vars = {};
    for (const [name, spec] of Object.entries(example.data_vars)) vars[name] = spec.dims;
  }
  if (!vars) throw new Error("this endpoint's example call sends no inline data to replace");
  const norm = (h) => String(h).trim().toLowerCase();
  const header = values[0].map(norm);
  const rows = values.slice(1).filter((r) => r.some((c) => String(c).trim() !== ""));
  const used = Object.keys(vars).filter((name) => header.indexOf(norm(name)) >= 0);
  if (!used.length) {
    throw new Error("the Input sheet needs a column named one of: " + Object.keys(vars).join(", "));
  }
  const targets = ["sales"];
  const dims = [...new Set(Object.values(vars).flat())];
  const known = new Set(Object.keys(vars).concat(dims).map(norm));
  const unknown = values[0].filter((h) => norm(h) !== "" && !known.has(norm(h)));
  if (targets.length && !targets.some((t) => used.indexOf(t) >= 0) && unknown.length) {
    throw new Error(
      "the Input sheet has no column for " + targets.join(", ") + " (the actuals) but has " +
        unknown.map((h) => '"' + String(h).trim() + '"').join(", ") +
        "; the columns are: " + dims.concat(Object.keys(vars)).join(", ")
    );
  }
  const column = (name) => {
    const i = header.indexOf(norm(name));
    if (i < 0) throw new Error('the Input sheet needs a column named "' + name + '"');
    return i;
  };
  const cell = (v) => (v instanceof Date ? Utilities.formatDate(v, zone, "yyyy-MM-dd") : v);
  const number = (v) => {
    if (typeof v !== "string") return cell(v);
    const text = v.trim();
    if (text === "") return null;
    if (/^[-+]?\d{1,3}(,\d{3})+(\.\d+)?$/.test(text)) return Number(text.replace(/,/g, ""));
    return /^[-+]?(\d+(\.\d*)?|\.\d+)([eE][-+]?\d+)?$/.test(text) ? Number(text) : text;
  };
  const coords = {};
  const index = {};
  for (const name of used) {
    for (const dim of vars[name]) {
      if (index[dim]) continue;
      const i = column(dim);
      index[dim] = new Map();
      const seen = [];
      rows.forEach((r, k) => {
        const key = cell(r[i]);
        if (key === "") {
          throw new Error("row " + (k + 2) + ' of the Input sheet has no "' + dim + '"');
        }
        if (!index[dim].has(key)) {
          index[dim].set(key, seen.length);
          seen.push(key);
        }
      });
      coords[dim] = { dims: [dim], data: seen };
    }
  }
  const data_vars = {};
  for (const name of used) {
    const dims = vars[name];
    const i = column(name);
    const value = (r) => (r[i] === "" ? null : number(r[i]));
    if (!dims.length) {
      data_vars[name] = { dims: [], data: rows.length ? value(rows[0]) : null };
      continue;
    }
    const last = dims.length - 1;
    const empty = (k) => coords[dims[k]].data.map(() => (k < last ? empty(k + 1) : null));
    const data = empty(0);
    for (const r of rows) {
      const v = value(r);
      if (v === null) continue;
      const at = dims.map((dim) => index[dim].get(cell(r[column(dim)])));
      let node = data;
      for (let k = 0; k < last; k++) node = node[at[k]];
      if (node[at[last]] !== null && node[at[last]] !== v) {
        throw new Error('"' + name + '" has two different values at one row of the Input sheet');
      }
      node[at[last]] = v;
    }
    data_vars[name] = { dims: dims, data: data };
  }
  return { coords: coords, data_vars: data_vars };
}

// The periods to forecast: the rows after the last one with a target value (every row
// when none has one); the horizon's own periods when the sheet ends with an actual.
function mapiForecastPeriods_(payload, fallback) {
  const dim = payload.horizon.dim;
  const labels = payload.data.coords[dim] ? payload.data.coords[dim].data : [];
  const filled = new Set();
  for (const name of ["sales"]) {
    const spec = payload.data.data_vars[name];
    if (!spec) continue;
    const axis = spec.dims.indexOf(dim);
    const walk = (node, depth, at) => {
      if (depth === spec.dims.length) {
        if (node !== null) filled.add(at);
        return;
      }
      node.forEach((child, k) => walk(child, depth + 1, depth === axis ? k : at));
    };
    if (axis >= 0) walk(spec.data, 0, -1);
  }
  const order = labels.map((_, k) => k).sort((a, b) => (labels[a] < labels[b] ? -1 : 1));
  if (!filled.size) return labels.length || fallback;
  let after = 0;
  for (let k = order.length - 1; k >= 0 && !filled.has(order[k]); k--) after++;
  return after || fallback;
}
Obey these rules, so that the sheet does what you expect:
- Dates are cells with a date format, or text in
yyyy-MM-dd. The script sends them asyyyy-MM-ddin the time zone of the spreadsheet. The rows can be in any sequence. - Headers match without the spaces around them, and case is not important. Possibly the script cannot find the target column, and the sheet has columns that the script does not know. Then the script gives an error that lists the expected columns. It never gives a forecast that silently ignores your actuals.
- Numbers stored as text (a pasted CSV, a Plain-text column) go as numbers. A cell that
holds only spaces is empty. The platform refuses other text in a number column (
#N/A) withSCHEMA_INVALID. The error names the column and the date. - No rows (only the header): the model forecasts the 8 periods after the fit, as without a sheet.
- An empty target after the last actual is a date to forecast. If the sheet ends with an
actual, the model forecasts the 8 periods after it (the
horizon.periodsof the call). - An empty target between actuals is a gap. The refusal
ACTUALS_INVALIDtells you this. This is not the case if the model accepts missing observations. The state-space models accept them and filter them as missing. - Actuals inside the fitted range replace the fitted values (a revised figure). The parameters stay as fitted. Fit the model again from time to time, so that the parameters learn from the new data.
- A model that cannot use actuals refuses the sheet with
ACTUALS_NOT_SUPPORTED. It does not ignore the numbers. To forecast from the end of its fit, keep the target empty. Alternatively, fit the model again. The script writes the refusal and the corrective action into Result.
When something goes wrong
| What the sheet or the editor shows | Why | What to do |
|---|---|---|
401: … |
There is no token, or the token is revoked or expired. | Examine the MAPI_TOKEN script property. Create a new token. |
403: … |
The scope of the token is not score:<this alias>, or the project header is not correct. |
Create the token from the Sheets card. Examine MAPI_PROJECT. |
404: … |
A person deleted or renamed the endpoint. | Select the endpoint again in the Sheets card. |
409: … with IDEMPOTENCY_CONFLICT |
CALL changed after the first run of the day, with the same key. |
Wait until the next day, or change the prefix of the key. |
422: … with MISSING_FUTURE_COVARIATE, or 409: … with HORIZON_EXCEEDS_FIT |
The call asks for something that the model cannot answer. Possibly it asks for future values that the model does not have, or for more periods than the model can forecast. | Copy the payload from the snippet of the endpoint again. Make the horizon shorter. |
422: … with ACTUALS_NOT_SUPPORTED (also in Result) |
The Input sheet has target values, and the model of the endpoint cannot update a forecast with them. | To forecast from the end of the fit, keep the target empty. Alternatively, fit the model again with the new data. |
422: … with ACTUALS_INVALID |
There is an empty target between two actuals. Alternatively, the actuals do not continue the fitted history, or a row with an actual has no driver value. | Fill the gap, or remove the rows after it. Start immediately after the fit. Fill the driver. |
422: … with SCHEMA_INVALID that names a column |
A target or driver cell holds text that is not a number (#N/A, n/a). |
Clear the cell, or type the number in it. |
failed: no summary in the answer in Result, and then the problem |
The API accepted the call, but the run failed. For inline data, only the run can do some checks. For example, one series of a panel has no driver on an actual month. (The API check sees all series together.) | Read the problem line below it. Correct the rows that it names. |
the Input sheet has no column for y (the actuals) but has "sales" |
The header of the target column is not the name that the endpoint uses. | Rename the column to the listed name. Copy the header from the Sheets card. |
the Input sheet needs a column named "t" |
The header of the Input sheet does not name the columns of the endpoint. | Copy the header from the Sheets card. Alternatively, run score<Alias>InputSheet on a sheet without Input. |
429: … with RATE_LIMITED or QUOTA_EXCEEDED |
The rate limit of the token, its budget or a project quota. | Increase the limit or the budget on the Tokens page, or refresh less frequently. |
| This endpoint's model wrote no forecast table. | The call is not a forecast, or the outputs of the model have no KPI for a table. | Use a forecast call. For other outputs, read the result with the Python client. |
Next
- Embed a chart in a doc or a dashboard, next to the sheet.
- Receive webhooks to refresh the sheet immediately when a better model goes live. Then you do not need a timer.
- The Integrations hub gives all the snippet and token options.