01 · Estimands and shown numbers
You will learn
- Describe a number with its seven-field estimand
- Make numbers that always carry an interval
- Check whether two numbers can be combined (G-EST-02)
- Add channels up honestly (G-DEP-01) and find your fallback rung
You need
- Python 3.12 and uv
- The notebooks project (babelfin comes with it)
Runs offline. Uses babelfin (import babelfin as fin), UMP’s analyst-facing API.
Northwind Outdoor’s media lead has two numbers on her desk the Thursday before budget lock. The agency’s MMM says social returns $1.40 per dollar. Last spring’s geo test says $0.95. Which is right?
Possibly both. The MMM number is the return on the last dollar over a year; the test number is the return from adding spend for six weeks. Before anyone averages them, UMP asks what each number means. That is the estimand, and every number UMP exchanges carries one.
This notebook shows how to:
- describe what a number means, starting from a registered question;
- make a number that always carries its interval;
- check whether two numbers can be combined (the G-EST-02 ladder);
- add channels up honestly (the G-DEP-01 envelope);
- find the fallback-ladder rung for what you have.
Values marked proposed are starting points pending the pre-rollout studies (spec §22).
import babelfin as finimport matplotlib.pyplot as pltimport numpy as npimport pandas as pd1. What does the number mean?
Section titled “1. What does the number mean?”Start from a registered estimand and change only what differs. "mroi" is the registry’s marginal ROI at the
current plan; "iroas" is a geo test’s incremental ROAS. Aliases: roi, mroi, iroas, lift, or any
registry id.
mmm_q = fin.estimand("mroi", channels="social", weeks=52, interval="hdi")test_q = fin.estimand("iroas", channels="social", weeks=6, level=0.8)mmm_qdetails
| intervention | {'type': 'marginal', 'size': 0.1, 'size_kind': 'relative', 'arms': [], 'population': 'geo_set'} |
|---|---|
| baseline | current_plan |
| horizon | {'type': 'window', 'weeks': 52} |
| unit | {'kpi': 'revenue', 'per': 'spend', 'cost_basis': 'net', 'currency': 'USD'} |
| point_rule | posterior_median |
| interval | {'method': 'hdi', 'level': 0.9} |
| schema_version | est-registry/1.2.0 |
| applies_to | {'media_ids': ['social'], 'geo_ids': []} |
| metric_family | sales_return |
test_qdetails
| intervention | {'type': 'add', 'arms': ['treatment'], 'population': 'geo_set'} |
|---|---|
| baseline | control_counterfactual |
| horizon | {'type': 'window', 'weeks': 6} |
| unit | {'kpi': 'revenue', 'per': 'spend', 'cost_basis': 'net', 'currency': 'USD'} |
| point_rule | estimator_point |
| interval | {'method': 'confidence', 'level': 0.8} |
| schema_version | est-registry/1.2.0 |
| applies_to | {'media_ids': ['social'], 'geo_ids': []} |
| metric_family | sales_return |
Changing a scope field (channels, geos, client) keeps the registry id. Changing one of the seven fields
(here weeks and the interval) makes it a custom question, and the registry id is dropped so nobody mistakes it
for the registered one.
print(fin.estimand("mroi", channels="social").registry_id, "|", mmm_q.registry_id)E-MMM-MROI | None
2. Numbers carry their interval
Section titled “2. Numbers carry their interval”fin.number(value, (lo, hi), estimand). There is no way to make a bare point; in Jupyter the number renders
as a card with its meaning one click away.
mmm = fin.number(1.40, (1.05, 1.82), mmm_q, label="Social mROI (MMM)")test = fin.number(0.95, (0.61, 1.30), test_q, label="Social iROAS (geo test)")mmmdetails
| means | revenue per dollar, net from a small increase in spend (+10%), geo_set, versus the current plan, over 52 weeks, posterior median, 90% hdi |
|---|---|
| interval | 90% hdi 1.05 to 1.82 |
| trust level | 2 |
testdetails
| means | revenue per dollar, net from adding spend, geo_set, versus the control counterfactual, over 6 weeks, estimator point, 80% confidence |
|---|---|
| interval | 80% confidence 0.61 to 1.30 |
| trust level | 2 |
A vendor PDF that gives “1.2” and nothing else gets an imputed band, labelled, with trust level 1.
fin.imputed_number(1.2, "roi", label="Vendor social ROI")details
| means | revenue per dollar, net from removing all spend, geo_set, versus zero spend, total including carryover, posterior median, 90% eti |
|---|---|
| interval | 90% imputed 0.60 to 1.80 |
| trust level | 1 |
| G-UNC-01 UNCERTAINTY_IMPUTED | tier-default band (proposed); interval imputed |
3. Can they be combined?
Section titled “3. Can they be combined?”fin.compare walks the ladder: match, converter, re-ask the model, assumed alignment with a widened interval,
side by side. It never silently averages two different questions.
fin.compare(mmm, test)details
| why | mismatch limited to assumable fields |
|---|---|
| interval after | 0.61 to 1.82 |
| field | first | second |
|---|---|---|
| intervention | type marginal, size 0.1, size_kind relative, arms , population geo_set | type add, arms treatment, population geo_set |
| baseline | current_plan | control_counterfactual |
| horizon | type window, weeks 52 | type window, weeks 6 |
| point_rule | posterior_median | estimator_point |
| interval | method hdi, level 0.9 | method confidence, level 0.8 |
fin.compare(mmm, test).to_frame()| field | first | second | |
|---|---|---|---|
| 0 | intervention | type marginal, size 0.1, size_kind relative, a... | type add, arms treatment, population geo_set |
| 1 | baseline | current_plan | control_counterfactual |
| 2 | horizon | type window, weeks 52 | type window, weeks 6 |
| 3 | point_rule | posterior_median | estimator_point |
| 4 | interval | method hdi, level 0.9 | method confidence, level 0.8 |
One pair is never assumed aligned: an average ROI against a last-dollar mROI. Those answer different questions, so they go side by side.
fin.compare(fin.estimand("roi"), fin.estimand("mroi"))details
| why | a remove-all (ROI) and a marginal (mROI) intervention answer different questions |
|---|
| field | first | second |
|---|---|---|
| intervention | type remove_all, size -1.0, size_kind relative, arms , population geo_set | type marginal, size 0.1, size_kind relative, arms , population geo_set |
| baseline | zero_spend | current_plan |
For a number going into a sealed decision, a labelled best guess may not be enough. strict=True turns the
fallback into a stop.
try: fin.compare(mmm, test, strict=True)except fin.Stopped as stop: print(stop.code, "-", stop.detail)ESTIMAND_ALIGNED - estimands differ on ['intervention', 'baseline', 'horizon', 'point_rule', 'interval']; strict mode stops at assumed_alignment
4. Adding channels up honestly
Section titled “4. Adding channels up honestly”A vendor table gives per-channel intervals but no joint draws, and display has no interval at all. How the channels’ errors move together is unknown, so the total is the envelope between the independent sum (narrowest) and the comonotone sum (widest), labelled.
roi = fin.estimand("roi")contributions = { "tv": fin.number(4.1e6, (2.9e6, 5.6e6), roi), "search": (3.2e6, 2.7e6, 3.8e6), # a (value, lo, hi) tuple works too "social": (1.6e6, 0.9e6, 2.4e6), "display": 0.7e6, # no interval: imputed and labelled}vendor_total = fin.total(contributions)vendor_totaldetails
| G-UNC-01 UNCERTAINTY_IMPUTED | display tier-default band +/-50% (proposed); interval imputed |
|---|---|
| G-DEP-01 DEPENDENCE_ASSUMED | independence; interval is envelope of independent and comonotone |
| sum | lo | hi |
|---|---|---|
| independent | 8.082601e+06 | 1.143644e+07 |
| comonotone | 6.850000e+06 | 1.285000e+07 |
| reported | 6.850000e+06 | 1.285000e+07 |
With joint draws (one fit, many draws per channel) the total uses them directly: no assumption, no fallback. Pass a draws-by-channels DataFrame.
rng = np.random.default_rng(7)draws = pd.DataFrame(rng.multivariate_normal([4.1, 3.2, 1.6, 0.7], np.diag([0.6, 0.3, 0.4, 0.2]) ** 2 + 0.05, size=4000) * 1e6, columns=list(contributions))joint_total = fin.total(draws)joint_totaldetails
| sum | lo | hi |
|---|---|---|
| independent | 7.680340e+06 | 1.164224e+07 |
| comonotone | 7.680340e+06 | 1.164224e+07 |
| reported | 7.680340e+06 | 1.164224e+07 |
fig, ax = plt.subplots(figsize=(7, 2.2))rows = {"vendor table (envelope)": vendor_total, "joint draws": joint_total}for i, (name, t) in enumerate(rows.items()): ax.plot([t.lo / 1e6, t.hi / 1e6], [i, i], lw=6, solid_capstyle="butt") ax.plot(t.value / 1e6, i, "k|", ms=14)ax.set_yticks(range(len(rows)), list(rows))ax.set_xlabel("total incremental revenue, $M (90% interval)")plt.tight_layout()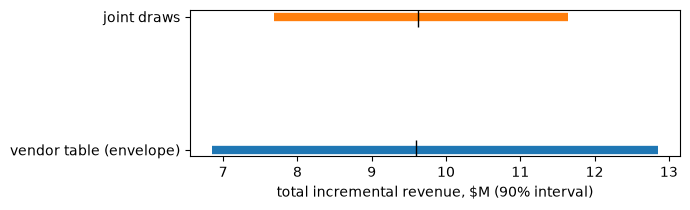
5. The fallback ladder
Section titled “5. The fallback ladder”When the full model is not available UMP steps down: full model, curve parameters, spend table, summary (warned), benchmarks (warned), not available.
pd.DataFrame([{"you have": ", ".join(have) or "nothing", "rung": d.step, "warned": d.warned} for have in (["full_model", "curve_params"], ["spend_table"], ["summary"], []) for d in [fin.ladder(have)]])| you have | rung | warned | |
|---|---|---|---|
| 0 | full_model, curve_params | full_model | False |
| 1 | spend_table | spend_table | False |
| 2 | summary | summary | True |
| 3 | nothing | benchmarks | True |
Going deeper
Section titled “Going deeper”Every babelfin object keeps the contract model on .spec (mmm.spec is a ump_spec ShownNumber), and
.explain() prints the details as text. The full contract is in ump_spec when you need it.