11 · Conversion lift: ITT, CACE and why platform A/B never calibrates
You will learn
- Plan a lift test with power and assurance
- Tell intent-to-treat from the effect on the exposed (CACE)
- Correct segment results for multiple tests with Benjamini-Hochberg
- See a class D platform A/B test excluded from calibration
You need
- Python 3.12 and uv
- Notebook 01, or the estimand idea from it
Runs offline. Uses babelfin, NumPy, pandas, SciPy and matplotlib. The data is SYNTHETIC, generated below with a
known truth (TRUE), so every number can be checked.
Northwind Outdoor’s six-week YouTube flight has ended. Li Wei has two readouts on her desk and a budget meeting on Thursday. The platform’s “A/B creative test” says +18% conversions, and the CMO has already put that in a slide. The other readout is the ghost-ads user holdout the agency pre-registered. Its first number looks disappointingly small next to 18%.
This notebook is Li’s afternoon: plan, readout, a false start, the segment trap, and what UMP lets each number do.
import babelfin as finimport matplotlib.pyplot as pltimport numpy as npimport pandas as pdfrom scipy.stats import norm
SEED = 8Z90 = norm.ppf(0.95)                              # every interval here is 90%, matching the estimandspd.set_option("display.max_colwidth", None)       # an estimand is a sentence; never cut it short

def table(numbers):    """A list of fin.Number as rows: value, interval and the estimand in words."""    return pd.DataFrame([{"label": n.label, "value": n.value, "lo": n.lo, "hi": n.hi, "estimand": n.estimand.words}                         for n in numbers]).round(2)
1. Two numbers on Li’s desk and the CMO’s 18%
Section titled “1. Two numbers on Li’s desk and the CMO’s 18%”The three estimands Li will hand over. Same KPI (conversions), same channel and window, different populations. Rates are tiny (0.4% is “big” here), so every rate is scaled per 1,000 users.
itt_e = fin.estimand("E-USER-ITT", kpi="conversions_per_1000_eligible_users", per="absolute", population="itt", channels="youtube", weeks=6, level=0.9)cace_e = fin.estimand("E-USER-ITT", kpi="conversions_per_1000_exposed_users", per="absolute", population="exposed", channels="youtube", weeks=6, level=0.9)iroas_e = fin.estimand("E-USER-ITT", kpi="revenue", per="spend", population="itt", channels="youtube", weeks=6, level=0.9)for e in (itt_e, cace_e, iroas_e): print("-", e.words)- conversions per 1000 eligible users in total, net from removing all spend, itt, versus the control counterfactual, over 6 weeks, estimator point, 90% confidence - conversions per 1000 exposed users in total, net from removing all spend, exposed, versus the control counterfactual, over 6 weeks, estimator point, 90% confidence - revenue per dollar, net from removing all spend, itt, versus the control counterfactual, over 6 weeks, estimator point, 90% confidence
2. Plan first: power and assurance
Section titled “2. Plan first: power and assurance”Three weeks before launch, the client asked for a 10% holdout (“we don’t want to lose 20% of the audience”). Li sized it with a normal approximation, with no simulation needed:
- SE of CACE ≈ √(p(1−p)(1/n_t + 1/n_c)) ÷ exposure rate, at p = 2% and 35% expected reach.
- Assurance is power averaged over what we believe the effect is. The belief came from the Tier D MMM’s YouTube summary, translated to about 5 per 1,000 exposed users, sd 1.5. That translation is an assumption.
PRIOR = {"mean": 5.0, "sd": 1.5}     # per 1,000 exposed users; ASSUMED, from the MMM's Tier D summary

def se_cace(n, treat_share, reach=0.35, p=0.02):    """Normal-approximation SE of the Wald CACE, per 1,000 exposed users."""    nt, nc = n * treat_share, n * (1 - treat_share)    return 1000 * np.sqrt(p * (1 - p) * (1 / nt + 1 / nc)) / reach

def assurance(n, treat_share):    s = se_cace(n, treat_share)    d = np.random.default_rng(0).normal(PRIOR["mean"], PRIOR["sd"], 200_000)    return float(np.mean(norm.cdf(d / s - Z90) + norm.cdf(-d / s - Z90)))

def mde80(n, treat_share):          # smallest effect detected with 80% power at the 90% level    return (Z90 + norm.ppf(0.8)) * se_cace(n, treat_share)

plans = pd.DataFrame([{"holdout": f"{1 - s:.0%}", "SE per 1k exposed": se_cace(400_000, s), "MDE80 per 1k exposed": mde80(400_000, s), "assurance": assurance(400_000, s)} for s in (0.9, 0.8)]).round(2)plans| holdout | SE per 1k exposed | MDE80 per 1k exposed | assurance | |
|---|---|---|---|---|
| 0 | 10% | 2.11 | 5.24 | 0.72 |
| 1 | 20% | 1.58 | 3.93 | 0.86 |
The 10% holdout gives about 72% assurance. UMP’s floor is 80% (proposed, §9). The plan goes through
fin.check as a plain dict: babelfin has no TestPlan wrapper, so the dict is the document.
plan = {"client_id": "northwind-outdoor", "question": "Does YouTube drive incremental conversions?", "decision_informed": "Q1 YouTube budget", "channel": "youtube", "primary_metric": "conversions", "estimand": cace_e.to_dict(), "design": "ghost_ads", "estimator": "cace", "admissibility_class": "A", "power": {"assurance": round(assurance(400_000, 0.9), 2), "mde": round(mde80(400_000, 0.9), 2), "duration_weeks": 6}}fin.check("test_plan", plan).to_frame()| gate | outcome | message | codes | |
|---|---|---|---|---|
| 0 | G-EXP-01 | fallback | not pre-registered | NOT_PREREGISTERED |
| 1 | G-EXP-02 | warn | assurance 72% is below the 80% proposed floor | LOW_ASSURANCE |
Two gates fire, and neither blocks:
- G-EXP-02 warns
LOW_ASSURANCE. - G-EXP-01 falls back: the plan is not locked yet.
G-EXP-03, the spillover check, does not apply. Users are randomised one by one, so there are no neighbouring geos to leak into. Li takes the warning to the client and wins a 20% holdout. Then she locks the plan.
revised = {**plan, "power": {"assurance": round(assurance(400_000, 0.8), 2), "mde": round(mde80(400_000, 0.8), 2), "duration_weeks": 6}, "preregistration": {"locked": True, "primary_metric": "conversions", "analysis_method": "cace", "decision_rule": "scale YouTube if the CACE 90% interval excludes 0"}, "status": "locked"}r = fin.check("test_plan", revised)print(r, "| assurance", revised["power"]["assurance"])<GateReport Would pass · 0 stops · 0 fallbacks · 0 warnings · 12 gates (0 fired)> | assurance 0.86
3. Simulate the holdout, with ghost-ad flags
Section titled “3. Simulate the holdout, with ghost-ad flags”Each eligible user is randomised: 80% treat, 20% control. In treat, the ad server reaches 35% of users. In control the ads are suppressed, but the server logs a ghost ad wherever it would have served. Reached users are heavier converters to start with (3.6% vs 1.1%), which is why naive “exposed vs unexposed” comparisons lie.
Truth: +4.0 conversions per 1,000 exposed users, concentrated in the 25 to 34 band.
TRUE = {"n_eligible": 400_000, "treat_share": 0.8, "exposure_rate": 0.35, "base_cr": 0.020,        "base_cr_reached": 0.036, "cace_abs_lift": 0.0040, "itt_abs_lift": 0.0014, "aov": 85.0, "spend": 24_000,        "segment_share": {"18_24": 0.15, "25_34": 0.35, "35_54": 0.40, "55_plus": 0.10},        "segment_cace": {"18_24": 0.0, "25_34": 0.0080, "35_54": 0.0030, "55_plus": 0.0},        "platform_ab_selection_bias": 0.0026}# The truth is internally consistent: segment lifts average to the overall CACE, ITT = CACE x reach.assert np.isclose(sum(TRUE["segment_share"][s] * TRUE["segment_cace"][s] for s in TRUE["segment_cace"]),                  TRUE["cace_abs_lift"])assert np.isclose(TRUE["cace_abs_lift"] * TRUE["exposure_rate"], TRUE["itt_abs_lift"])TRUE["iroas"] = TRUE["itt_abs_lift"] * TRUE["n_eligible"] * TRUE["treat_share"] * TRUE["aov"] / TRUE["spend"]

def simulate(seed=SEED):    rng = np.random.default_rng(seed)    n = TRUE["n_eligible"]    segment = rng.choice(list(TRUE["segment_share"]), n, p=list(TRUE["segment_share"].values()))    treat = rng.random(n) < TRUE["treat_share"]    would_serve = rng.random(n) < TRUE["exposure_rate"]          # the ad server's choice, logged in both arms    p_rest = (TRUE["base_cr"] - TRUE["exposure_rate"] * TRUE["base_cr_reached"]) / (1 - TRUE["exposure_rate"])    lift = pd.Series(segment).map(TRUE["segment_cace"]).to_numpy()    p = np.where(would_serve, TRUE["base_cr_reached"], p_rest) + (treat & would_serve) * lift    return pd.DataFrame({"segment": segment, "treat": treat, "exposed": treat & would_serve,                         "ghost": ~treat & would_serve, "converted": rng.random(n) < p})

users = simulate()users.groupby("treat").agg(users=("converted", "size"), exposed=("exposed", "mean"), ghost=("ghost", "mean"), conv_rate=("converted", "mean")).round(4)| users | exposed | ghost | conv_rate | |
|---|---|---|---|---|
| treat | ||||
| False | 80039 | 0.0000 | 0.3519 | 0.0199 |
| True | 319961 | 0.3499 | 0.0000 | 0.0214 |
The ghost flag earns its keep before any lift is computed: control’s ghost rate matches treat’s exposure rate, so the ad server picked the same kind of people in both arms.
4. ITT, a false start, then CACE
Section titled “4. ITT, a false start, then CACE”ITT is the plain difference in conversion rates between the arms: everyone assigned, reached or not.
def itt_cace(df):    """ITT and Wald CACE (ITT / exposure rate) with delta-method SEs, both per 1,000 users."""    t, c = df[df.treat], df[~df.treat]    y_t, y_c, d_t = t.converted.to_numpy(float), c.converted.to_numpy(float), t.exposed.to_numpy(float)    itt, r = y_t.mean() - y_c.mean(), d_t.mean()    v_itt = y_t.var(ddof=1) / len(y_t) + y_c.var(ddof=1) / len(y_c)    v_r, cov = r * (1 - r) / len(d_t), np.cov(y_t, d_t)[0, 1] / len(d_t)    v_cace = v_itt / r**2 + itt**2 * v_r / r**4 - 2 * itt * cov / r**3    return {"itt": 1000 * itt, "itt_se": 1000 * np.sqrt(v_itt), "cace": 1000 * itt / r,            "cace_se": 1000 * np.sqrt(v_cace), "reach": r}

est = itt_cace(users)itt = fin.number(est["itt"], (est["itt"] - Z90 * est["itt_se"], est["itt"] + Z90 * est["itt_se"]), itt_e, label="YouTube ITT lift")ittdetails
| means | conversions per 1000 eligible users in total, net from removing all spend, itt, versus the control counterfactual, over 6 weeks, estimator point, 90% confidence |
|---|---|
| interval | 90% confidence 0.62 to 2.45 |
| trust level | 2 |
Li’s first draft said “+1.5 conversions per 1,000 exposed users”. It went into the deck under the CMO’s 18%, and it looked feeble. It is also wrong: ITT divides by everyone eligible, and 65% of them never saw an ad. Attaching the exposed-user estimand to the ITT value makes the error visible in words:
false_start = fin.number(itt.value, (itt.lo, itt.hi), cace_e, label="DRAFT: ITT mislabelled as per exposed")print(false_start.estimand.words)print("value says per 1,000 eligible; the words say per 1,000 exposed -> withdrawn")conversions per 1000 exposed users in total, net from removing all spend, exposed, versus the control counterfactual, over 6 weeks, estimator point, 90% confidence value says per 1,000 eligible; the words say per 1,000 exposed -> withdrawn
CACE (complier average causal effect) rescales ITT by the share actually reached. This is the Wald / IV ratio. It is valid because control could not be exposed (one-sided non-compliance) and assignment only moves conversions through exposure. The delta-method interval is checked against a bootstrap of the arm totals.
cace = fin.number(est["cace"], (est["cace"] - Z90 * est["cace_se"], est["cace"] + Z90 * est["cace_se"]), cace_e,                  label="YouTube CACE lift")

def bootstrap_cace(df, reps=2000, seed=SEED):    """Resample users within arms via multinomial cell counts (same as row resampling, much faster)."""    rng = np.random.default_rng(seed + 1)    t, c = df[df.treat], df[~df.treat]    cells = t.groupby(["exposed", "converted"]).size().reindex(pd.MultiIndex.from_product([[False, True]] * 2),                                                               fill_value=0)    keys, n_t, n_c = list(cells.index), len(t), len(c)    draws_t = rng.multinomial(n_t, cells.to_numpy() / n_t, reps)    conv_t = draws_t[:, [i for i, k in enumerate(keys) if k[1]]].sum(1) / n_t    reach = draws_t[:, [i for i, k in enumerate(keys) if k[0]]].sum(1) / n_t    conv_c = rng.binomial(n_c, c.converted.mean(), reps) / n_c    return 1000 * (conv_t - conv_c) / reach

boot = bootstrap_cace(users)pd.DataFrame({"method": ["delta", "bootstrap"], "lo": [cace.lo, np.quantile(boot, 0.05)], "hi": [cace.hi, np.quantile(boot, 0.95)]}).round(2)| method | lo | hi | |
|---|---|---|---|
| 0 | delta | 1.77 | 7.00 |
| 1 | bootstrap | 1.84 | 7.04 |
cacedetails
| means | conversions per 1000 exposed users in total, net from removing all spend, exposed, versus the control counterfactual, over 6 weeks, estimator point, 90% confidence |
|---|---|
| interval | 90% confidence 1.77 to 7.00 |
| trust level | 2 |
The two intervals agree to within a tenth, so the delta method is safe here.
Why ghost ads pay off twice: comparing reached users in treat with ghost-flagged users in control estimates the same CACE, using only the 35% who could ever respond. The noise from the other 65% drops out.
reached_t = users[users.exposed].convertedghost_c = users[users.ghost].convertedg = 1000 * (reached_t.mean() - ghost_c.mean())g_se = 1000 * np.sqrt(reached_t.var() / len(reached_t) + ghost_c.var() / len(ghost_c))ghost_cace = fin.number(g, (g - Z90 * g_se, g + Z90 * g_se), cace_e, label="YouTube CACE, ghost-ad comparison")print(f"Wald CACE width {cace.hi - cace.lo:.2f}; ghost-ad width {ghost_cace.hi - ghost_cace.lo:.2f} per 1,000 exposed")ghost_caceWald CACE width 5.23; ghost-ad width 4.14 per 1,000 exposed
details
| means | conversions per 1000 exposed users in total, net from removing all spend, exposed, versus the control counterfactual, over 6 weeks, estimator point, 90% confidence |
|---|---|
| interval | 90% confidence 1.73 to 5.87 |
| trust level | 2 |
5. Same KPI, different estimands
Section titled “5. Same KPI, different estimands”ITT and CACE are both “conversion lift on YouTube over six weeks”. UMP still refuses to put them in one column: G-EST-02 finds the population (and so the unit) differs, and shows them side by side.
alignment = fin.compare(itt, cace)print(alignment.explain())alignment.to_frame()rung: side_by_side (KPI, unit or scope differ) fields that differ: intervention, unit G-EST-02 ESTIMAND_ALIGNED: no defensible alignment; numbers shown side by side, not combined
| field | first | second | |
|---|---|---|---|
| 0 | intervention | type remove_all, size -1.0, size_kind relative, arms holdout, population itt | type remove_all, size -1.0, size_kind relative, arms holdout, population exposed |
| 1 | unit | kpi conversions_per_1000_eligible_users, per absolute, cost_basis net, currency USD | kpi conversions_per_1000_exposed_users, per absolute, cost_basis net, currency USD |
6. iROAS with an interval
Section titled “6. iROAS with an interval”Incremental revenue = ITT × treated users × AOV. The AOV of $85 is assumed (no order values in this test), so the interval carries only conversion noise. The spend of $24,000 is what the flight cost to reach this test’s treat arm.
n_treat = int(users.treat.sum())scale = n_treat / 1000 * TRUE["aov"] / TRUE["spend"]iroas = fin.number(itt.value * scale, (itt.lo * scale, itt.hi * scale), iroas_e, label="YouTube iROAS")print(f"TRUE iROAS {TRUE['iroas']:.2f}")iroasTRUE iROAS 1.59
details
| means | revenue per dollar, net from removing all spend, itt, versus the control counterfactual, over 6 weeks, estimator point, 90% confidence |
|---|---|
| interval | 90% confidence 0.70 to 2.78 |
| trust level | 2 |
7. Segments, forking paths and Benjamini-Hochberg
Section titled “7. Segments, forking paths and Benjamini-Hochberg”Four age bands were pre-registered. Four tests means four chances to be fooled. Li’s colleague also wanted gender, device and region: that would be twenty “findings” to choose from, which is how a forking path starts. Benjamini-Hochberg at q = 0.10 (proposed, §10) controls the false discovery rate across the four that were registered.
rows = []for seg, df in users.groupby("segment"): e = itt_cace(df) rows.append({"segment": seg, "cace": e["cace"], "se": e["cace_se"], "p": 2 * norm.sf(abs(e["cace"] / e["cace_se"]))})segs = pd.DataFrame(rows).sort_values("p").reset_index(drop=True)m, Q = len(segs), 0.10passed = segs.p.to_numpy() <= Q * np.arange(1, m + 1) / mk = (np.nonzero(passed)[0].max() + 1) if passed.any() else 0 # step-up: keep every test up to the last passsegs["bh_keep"] = segs.index < ksegs["truth"] = segs.segment.map(TRUE["segment_cace"]) * 1000segs.round(4)| segment | cace | se | p | bh_keep | truth | |
|---|---|---|---|---|---|---|
| 0 | 25_34 | 7.8441 | 2.7532 | 0.0044 | True | 8.0 |
| 1 | 35_54 | 4.3943 | 2.4871 | 0.0773 | False | 3.0 |
| 2 | 18_24 | -2.8350 | 4.0945 | 0.4887 | False | 0.0 |
| 3 | 55_plus | 3.1342 | 4.8163 | 0.5152 | False | 0.0 |
segment_numbers = [ fin.number(r.cace, (r.cace - Z90 * r.se, r.cace + Z90 * r.se), cace_e, label=f"CACE {r.segment}: " + ("detected (BH q=0.10)" if r.bh_keep else "not detected (BH q=0.10)")) for r in segs.itertuples()]table(segment_numbers)| label | value | lo | hi | estimand | |
|---|---|---|---|---|---|
| 0 | CACE 25_34: detected (BH q=0.10) | 7.84 | 3.32 | 12.37 | conversions per 1000 exposed users in total, net from removing all spend, exposed, versus the control counterfactual, over 6 weeks, estimator point, 90% confidence |
| 1 | CACE 35_54: not detected (BH q=0.10) | 4.39 | 0.30 | 8.49 | conversions per 1000 exposed users in total, net from removing all spend, exposed, versus the control counterfactual, over 6 weeks, estimator point, 90% confidence |
| 2 | CACE 18_24: not detected (BH q=0.10) | -2.83 | -9.57 | 3.90 | conversions per 1000 exposed users in total, net from removing all spend, exposed, versus the control counterfactual, over 6 weeks, estimator point, 90% confidence |
| 3 | CACE 55_plus: not detected (BH q=0.10) | 3.13 | -4.79 | 11.06 | conversions per 1000 exposed users in total, net from removing all spend, exposed, versus the control counterfactual, over 6 weeks, estimator point, 90% confidence |
Only 25 to 34 survives. Note the trap in 35 to 54: alone it clears p < 0.10, but as the second of four tests it needs p < 0.05. Picking it out after the fact is the forking path BH guards against.
“Not detected” is not zero. 35 to 54 has a real lift of 3 per 1,000 that this test is too small to confirm, and 55+ has an interval from about −5 to +11. The honest line for both is “we could not tell”, never “no effect”.
fig, ax = plt.subplots(figsize=(7, 2.8))for i, r in enumerate(segs.itertuples()): ax.plot([r.cace - Z90 * r.se, r.cace + Z90 * r.se], [i, i], color="C0" if r.bh_keep else "0.6", lw=3) ax.plot(r.cace, i, "o", color="C0" if r.bh_keep else "0.6") ax.plot(r.truth, i, "x", color="C3")ax.axvline(0, color="0.3", lw=0.8)ax.set_yticks(range(len(segs)), segs.segment)ax.set_xlabel("conversions per 1,000 exposed users (90% interval; x = truth)")ax.set_title("Segment CACE: blue kept by BH, grey not detected")plt.tight_layout()plt.show()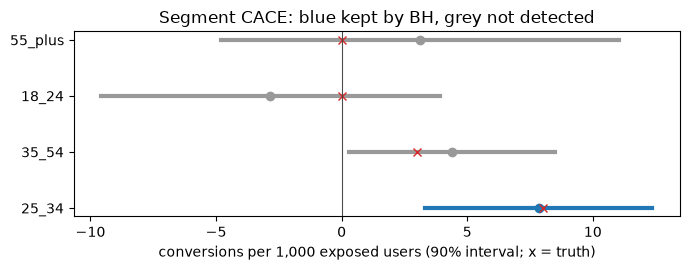
8. Class A holdout vs class D platform A/B
Section titled “8. Class A holdout vs class D platform A/B”Now the CMO’s 18%. The platform split the flight into a creative arm and a house-ad arm, then let its delivery algorithm pick who saw each. It found likelier buyers for the creative arm: a divergent-delivery test. Same true lift, plus a selection gap.
def platform_ab(seed=31, n_per_arm=150_000):          # the platform ran its own split: its own seed    rng = np.random.default_rng(seed)    p_a = TRUE["base_cr_reached"]    p_b = p_a + TRUE["cace_abs_lift"] + TRUE["platform_ab_selection_bias"]   # true lift + who the algorithm picked    a, b = rng.binomial(n_per_arm, p_a) / n_per_arm, rng.binomial(n_per_arm, p_b) / n_per_arm    se = np.sqrt(a * (1 - a) / n_per_arm + b * (1 - b) / n_per_arm)    return 1000 * (b - a), 1000 * se, (b - a) / a

ab, ab_se, ab_rel = platform_ab()platform = fin.number(ab, (ab - Z90 * ab_se, ab + Z90 * ab_se), cace_e, label="Platform A/B lift (class D)")print(f"platform relative lift {ab_rel:+.0%}; overstates TRUE CACE by {ab - 1000 * TRUE['cace_abs_lift']:.1f} per 1,000 " f"(selection gap {1000 * TRUE['platform_ab_selection_bias']:.1f})")platformplatform relative lift +18%; overstates TRUE CACE by 2.6 per 1,000 (selection gap 2.6)
details
| means | conversions per 1000 exposed users in total, net from removing all spend, exposed, versus the control counterfactual, over 6 weeks, estimator point, 90% confidence |
|---|---|
| interval | 90% confidence 5.39 to 7.73 |
| trust level | 2 |
A tight interval around the wrong number. UMP does not try to argue with it. It classifies it.
Both readouts become TestResult documents (plain dicts; the typed form is ump_spec.models.TestResult, and
babelfin has no wrapper), then go through fin.check(..., operation="calibrate").
def result(cls, method, number, **extra):    return {"client_id": "northwind-outdoor", "channel": "youtube", "admissibility_class": cls, "method": method,            "estimand": cace_e.to_dict(), "lift": number.to_dict(), "outcome": "positive", "duration_weeks": 6,            "applies_to": {"media_ids": ["youtube"]}, **extra}

doc_a = result("A", "cace", cace, preregistered=True, iroas=iroas.to_dict(), provenance_tier="own-experimental")doc_d = result("D", "platform_ab", platform, preregistered=False, provenance_tier="platform-reported")typed = fin.validate("test_result", doc_a)print(type(typed).__name__, typed.admissibility_class, typed.method)report_a = fin.check("test_result", doc_a, operation="calibrate")report_d = fin.check("test_result", doc_d, operation="calibrate")print("class A:", report_a)report_d.to_frame()TestResult A cace class A: <GateReport Would pass · 0 stops · 0 fallbacks · 0 warnings · 12 gates (0 fired)>
| gate | outcome | message | codes | |
|---|---|---|---|---|
| 0 | G-EXP-05 | exclude_and_continue | excluded from calibration: ['youtube'] (class D/E or contaminated) | EVIDENCE_EXCLUDED |
| 1 | G-EXP-01 | fallback | not pre-registered | NOT_PREREGISTERED |
The holdout passes clean. The platform A/B is excluded and the flow continues (G-EXP-05, EVIDENCE_EXCLUDED):
class D never calibrates incrementality, whatever its interval looks like. The CMO can keep the 18% as a creative
signal. It does not go into the model.
9. Attaching to the Tier D MMM: R4 falls back to R6
Section titled “9. Attaching to the Tier D MMM: R4 falls back to R6”Northwind’s MMM vendor ships only summary numbers (Tier D). Li asks for route R4 (reweight the posterior). R4 needs joint draws, which a Tier D model does not have.
calibration = {"client_id": "northwind-outdoor", "model_id_in": "mdl_nw_tierD", "route": "R4", "model_tier": "D", "tested_channel": "youtube"}cal_report = fin.check("calibration", calibration, operation="calibrate", context={"test_results": [doc_a]})cal_report.to_frame()| gate | outcome | message | codes | |
|---|---|---|---|---|
| 0 | G-CAL-02 | fallback | no excision chosen: default excision incl. adstock tail applied | DEFAULT_EXCISION |
| 1 | G-CAL-04 | fallback | Tier D is attach-only; route R4 replaced by R6 | ATTACH_ONLY |
Both are fallbacks, labelled:
- G-CAL-04
ATTACH_ONLY: R4 becomes R6. The readout sits beside the model, and the model is unchanged. - G-CAL-02
DEFAULT_EXCISION: no excision window was chosen, so the default (flight plus adstock tail) applies.
R6 never counts as calibrated. babelfin has no Calibration wrapper, so the typed model answers that directly:
from ump_spec.models import Calibration
attached = Calibration(**{**calibration, "route": "R6", "route_attempted": ["R4", "R6"], "attach_only": True})print("counts as calibrated:", attached.counts_as_calibrated)counts as calibrated: False
10. What Li hands over
Section titled “10. What Li hands over”- Asked: did YouTube drive incremental conversions, and is the platform’s +18% right?
- Handed over: the CACE and iROAS below, each with its estimand and 90% interval, checked against the truth.
- Assumed or fell back: AOV fixed at $85; the planning prior from the MMM; G-EXP-05 excluded the platform A/B; G-CAL-04 attached the holdout (R6) instead of reweighting; the default excision applied.
- Next: recommend the 25 to 34 band; plan a larger follow-up for 35 to 54 (“not detected” there means underpowered); ask the MMM vendor for Tier B curves so a later readout can actually calibrate.
handover = [itt, cace, iroas]check = pd.DataFrame({"number": [n.label for n in handover], "value": [n.value for n in handover], "lo": [n.lo for n in handover], "hi": [n.hi for n in handover], "truth": [1000 * TRUE["itt_abs_lift"], 1000 * TRUE["cace_abs_lift"], TRUE["iroas"]]})check["covered"] = (check.lo <= check.truth) & (check.truth <= check.hi)print(f"CACE / ITT = {cace.value / itt.value:.2f} (1 / reach = {1 / est['reach']:.2f})")check.round(2)CACE / ITT = 2.86 (1 / reach = 2.86)
| number | value | lo | hi | truth | covered | |
|---|---|---|---|---|---|---|
| 0 | YouTube ITT lift | 1.53 | 0.62 | 2.45 | 1.40 | True |
| 1 | YouTube CACE lift | 4.39 | 1.77 | 7.00 | 4.00 | True |
| 2 | YouTube iROAS | 1.74 | 0.70 | 2.78 | 1.59 | True |
Going deeper
Section titled “Going deeper”- Spec §9 (test plans and admissibility classes A to E) and §10 (calibration routes R1 to R6, BH conflicts).
docs/06-mmm-ema-technical-guide.md: EIG/EVOI, power and non-geo RCTs.- Notebook 01 for
fin.compareand the alignment ladder; notebook 02 forfin.checkand gate reports.
Next: take the same readout to a Tier B model, where R5 can adjust the YouTube curve instead of attaching.