13 · Brand lift survey to a brand_funnel model: cost per lifted person
You will learn
- Reweight a brand lift survey for differential non-response
- Correct many lift tests at once with Benjamini-Hochberg
- Turn lift points into people lifted per dollar
- Keep a class E survey out of sales calibration
You need
- Python 3.12 and uv
Runs offline. Uses babelfin (import babelfin as fin), plus NumPy, pandas, SciPy and scikit-learn.
Northwind Outdoor’s YouTube video ran for six weeks against 18-34s. The platform’s brand-lift survey came back with +4.2 points of aided awareness. Maya Chen’s first thought: feed it into the sales MMM as a calibration point before Thursday’s budget lock.
UMP says no to that, and then three more snags turn up. This notebook walks through them:
- a brand-lift survey is class E evidence, so it never calibrates sales incrementality;
- the survey asked five questions in three age bands, which makes 15 tests and no multiplicity correction;
- fewer people answered in control, and the ones who did were not like the rest;
- points of lift are not what a planner buys. People lifted per dollar is, and §25.10 has rules for it.
The answer lands in a brand_funnel model and a benchmark row that stays with Northwind.
import math
import babelfin as finimport matplotlib.pyplot as pltimport numpy as npimport pandas as pdfrom scipy.stats import normfrom sklearn.linear_model import LogisticRegression
pd.set_option("display.max_colwidth", None)SEED = 7
1. +4.2 points and the urge to calibrate the sales MMM with it
Section titled “1. +4.2 points and the urge to calibrate the sales MMM with it”The registry has a brand question: E-BM-BRAND-CPLP, aided awareness people per dollar. A points lift is the
same thing before the money: people lifted per 100 exposed people. Babelfin has no keyword for that unit, so we
edit the estimand’s dict and wrap it again (the metric_family rides along).
brand = fin.estimand("E-BM-BRAND-CPLP", channels="youtube", weeks=6)

def per_100_exposed(e):    """The same question, counted per 100 exposed respondents (a points lift)."""    d = e.to_dict()    # spec §5: per is spend, impression or absolute, so the denominator goes in the KPI name    d["unit"] = {"kpi": d["unit"]["kpi"] + "_per_100_exposed_respondents", "per": "absolute",                 **({"cost_basis": d["unit"]["cost_basis"]} if "cost_basis" in d["unit"] else {})}    return fin.estimand(d)

aware_pts = per_100_exposed(brand)headline = fin.number(4.2, (1.9, 6.5), aware_pts, label="Platform headline: YouTube aided awareness lift, 18-34")print(aware_pts.words, "| family:", aware_pts.spec.metric_family)headlineaided awareness people per 100 exposed respondents in total, net from removing all spend, exposed, versus the control counterfactual, over 6 weeks, estimator point, 95% confidence | family: brand_awareness
details
| means | aided awareness people per 100 exposed respondents in total, net from removing all spend, exposed, versus the control counterfactual, over 6 weeks, estimator point, 95% confidence |
|---|---|
| interval | 95% confidence 1.90 to 6.50 |
| trust level | 2 |
Maya’s plan was to hand this to the sales MMM. Hold that thought until section 7: the gates will answer it. First, she pulls the respondent-level file and checks the number herself.
2. Survey simulation with differential non-response
Section titled “2. Survey simulation with differential non-response”A randomised exposed/control survey. Everyone invited is known to the platform, including one covariate: whether
they follow outdoor channels (enthusiast). Enthusiasts are more aware of Northwind to begin with, and in control
they are also far more willing to answer a survey about it.
Why it matters: a common secondary-source rule of thumb is about 2,000 responses per metric for one headline read. Fifteen cuts need more, so the panel here is larger (about 34,000 responses).
BANDS = ["18_24", "25_34", "35_plus"]METRICS = ["awareness", "recall", "consideration", "favorability", "intent"]TRUE = {    "pp_lift": {        "awareness": {"18_24": 4.0, "25_34": 5.0, "35_plus": 0.0},        "consideration": {"18_24": 1.5, "25_34": 2.0, "35_plus": 0.0},        "recall": {"18_24": 3.0, "25_34": 3.0, "35_plus": 0.0},        "favorability": dict.fromkeys(BANDS, 0.0),        "intent": dict.fromkeys(BANDS, 0.0),    },    "resp_rate_exposed": 0.12, "resp_rate_control": 0.09,    "exposed_reach": {"18_24": 640_000, "25_34": 620_000, "35_plus": 140_000},  # 1.4M in total    "spend": 210_000,}TRUE["people_lifted_per_$_awareness_true"] = sum(    TRUE["pp_lift"]["awareness"][b] / 100 * TRUE["exposed_reach"][b] for b in BANDS) / TRUE["spend"]
BASE = {"awareness": (0.25, 0.55), "recall": (0.10, 0.18), "consideration": (0.05, 0.14),        "favorability": (0.30, 0.60), "intent": (0.04, 0.12)}          # (non-enthusiast, enthusiast)RESPONSE = {"exposed": (0.11, 0.14), "control": (0.07, 0.137)}       # gives about 12% and 9% overallINVITED = {"18_24": 70_000, "25_34": 70_000, "35_plus": 40_000}      # per arm

def simulate(seed):    rng = np.random.default_rng(seed)    parts = []    for arm in ("exposed", "control"):        for b in BANDS:            n = INVITED[b]            enth = rng.random(n) < 0.30            d = pd.DataFrame({"arm": arm, "band": b, "enthusiast": enth.astype(int)})            d["responded"] = (rng.random(n) < np.where(enth, RESPONSE[arm][1], RESPONSE[arm][0])).astype(int)            for m in METRICS:                p = np.where(enth, BASE[m][1], BASE[m][0]) + (TRUE["pp_lift"][m][b] / 100 if arm == "exposed" else 0)                d[m] = (rng.random(n) < p).astype(int)            parts.append(d)    return pd.concat(parts, ignore_index=True)

invited = simulate(SEED)invited.groupby("arm").agg(invited=("responded", "size"), response_rate=("responded", "mean")).round(3)| invited | response_rate | |
|---|---|---|
| arm | ||
| control | 180000 | 0.090 |
| exposed | 180000 | 0.118 |
The setback. Among people who answered, control is much heavier on enthusiasts, so control looks more aware than it should.
resp = invited[invited.responded == 1]resp.groupby("arm").agg(responses=("enthusiast", "size"), enthusiast_share=("enthusiast", "mean")).round(3)| responses | enthusiast_share | |
|---|---|---|
| arm | ||
| control | 16177 | 0.464 |
| exposed | 21296 | 0.354 |
3. Lift per metric and age band; reweighting for non-response
Section titled “3. Lift per metric and age band; reweighting for non-response”Absolute lift in points is exposed share minus control share, with a two-proportion z interval. The reweighted version models the chance each invited person answered (logistic regression on arm, band and enthusiast) and weights respondents by one over it. The SE uses Kish’s effective sample size.
Assumed: response depends only on what we observed (missing at random given these covariates). The SE ignores the uncertainty in the fitted propensities.
def add_weights(inv):    exp = (inv.arm == "exposed").astype(float)    X = pd.get_dummies(inv["band"]).astype(float)    X["enthusiast"], X["exposed"] = inv.enthusiast, exp    X["enth_x_exposed"] = inv.enthusiast * exp    for b in BANDS:        X[f"exposed_x_{b}"] = exp * (inv.band == b)    p = LogisticRegression(C=1e6, max_iter=2000).fit(X, inv.responded).predict_proba(X)[:, 1]    return inv.assign(w=1 / p)

def share(s, col, weighted):    w = s.w.to_numpy() if weighted else np.ones(len(s))    p = np.average(s[col], weights=w)    return p, p * (1 - p) / (w.sum() ** 2 / (w**2).sum())

def lift_table(inv):    r = add_weights(inv).query("responded == 1")    rows = []    for m in METRICS:        for b in BANDS:            row = {"metric": m, "band": b, "true_pts": TRUE["pp_lift"][m][b]}            for tag, weighted in (("unweighted", False), ("reweighted", True)):                (pe, ve), (pc, vc) = (share(r[(r.arm == a) & (r.band == b)], m, weighted) for a in ("exposed", "control"))                row[f"{tag}_pts"], row[f"{tag}_se"] = 100 * (pe - pc), 100 * math.sqrt(ve + vc)            rows.append(row)    t = pd.DataFrame(rows)    t["lo"], t["hi"] = t.reweighted_pts - 1.96 * t.reweighted_se, t.reweighted_pts + 1.96 * t.reweighted_se    t["covers_true"] = t.lo.le(t.true_pts) & t.hi.ge(t.true_pts)    t["p_value"] = 2 * norm.sf((t.reweighted_pts / t.reweighted_se).abs())    return t

lift = lift_table(invited)print("Each number:", aware_pts.words.replace("aided awareness ", "<metric> "))lift.round(2)Each number: <metric> people per 100 exposed respondents in total, net from removing all spend, exposed, versus the control counterfactual, over 6 weeks, estimator point, 95% confidence
| metric | band | true_pts | unweighted_pts | unweighted_se | reweighted_pts | reweighted_se | lo | hi | covers_true | p_value | |
|---|---|---|---|---|---|---|---|---|---|---|---|
| 0 | awareness | 18_24 | 4.0 | -0.47 | 0.82 | 2.81 | 0.83 | 1.18 | 4.44 | True | 0.00 |
| 1 | awareness | 25_34 | 5.0 | 1.80 | 0.82 | 5.26 | 0.83 | 3.64 | 6.88 | True | 0.00 |
| 2 | awareness | 35_plus | 0.0 | -3.01 | 1.07 | -0.04 | 1.08 | -2.16 | 2.09 | True | 0.97 |
| 3 | recall | 18_24 | 3.0 | 1.28 | 0.59 | 2.16 | 0.60 | 0.99 | 3.32 | True | 0.00 |
| 4 | recall | 25_34 | 3.0 | 2.54 | 0.60 | 3.35 | 0.60 | 2.18 | 4.53 | True | 0.00 |
| 5 | recall | 35_plus | 0.0 | -0.40 | 0.76 | 0.61 | 0.76 | -0.87 | 2.09 | True | 0.42 |
| 6 | consideration | 18_24 | 1.5 | 0.61 | 0.48 | 1.48 | 0.47 | 0.55 | 2.41 | True | 0.00 |
| 7 | consideration | 25_34 | 2.0 | 1.53 | 0.49 | 2.41 | 0.48 | 1.47 | 3.35 | True | 0.00 |
| 8 | consideration | 35_plus | 0.0 | -0.38 | 0.62 | 0.46 | 0.61 | -0.74 | 1.65 | True | 0.45 |
| 9 | favorability | 18_24 | 0.0 | -2.32 | 0.82 | 0.92 | 0.84 | -0.73 | 2.57 | True | 0.27 |
| 10 | favorability | 25_34 | 0.0 | -2.34 | 0.83 | 1.11 | 0.84 | -0.54 | 2.76 | True | 0.19 |
| 11 | favorability | 35_plus | 0.0 | -2.24 | 1.10 | 1.23 | 1.12 | -0.96 | 3.42 | True | 0.27 |
| 12 | intent | 18_24 | 0.0 | -1.30 | 0.42 | -0.37 | 0.41 | -1.17 | 0.42 | True | 0.36 |
| 13 | intent | 25_34 | 0.0 | -0.40 | 0.43 | 0.48 | 0.42 | -0.34 | 1.31 | True | 0.25 |
| 14 | intent | 35_plus | 0.0 | -0.45 | 0.58 | 0.36 | 0.56 | -0.74 | 1.46 | True | 0.53 |
Unweighted, every metric reads low, and the null ones read negative. That is the control group’s extra enthusiasts. Reweighting moves each estimate back toward the truth.
aw = lift[lift.metric.isin(["awareness", "consideration"])].reset_index(drop=True)y = np.arange(len(aw))fig, ax = plt.subplots(figsize=(7, 3.6))ax.errorbar(aw.unweighted_pts, y + 0.15, xerr=1.96 * aw.unweighted_se, fmt="o", color="0.6", label="unweighted")ax.errorbar(aw.reweighted_pts, y - 0.15, xerr=1.96 * aw.reweighted_se, fmt="o", color="C0", label="reweighted (95%)")ax.scatter(aw.true_pts, y, marker="x", color="C3", zorder=3, label="truth")ax.axvline(0, color="0.8", lw=1)ax.set_yticks(y, aw.metric + " " + aw.band)ax.set_xlabel("lift, points (people lifted per 100 exposed)")ax.legend(loc="lower right", fontsize=8)ax.set_title("YouTube, 6 weeks: awareness and consideration lift")plt.tight_layout()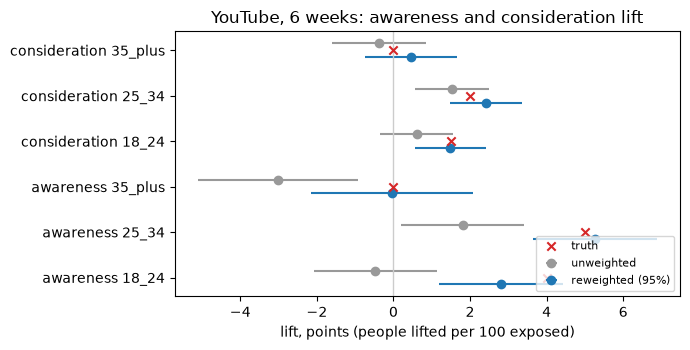
The campaign bought 18-34. Weighting the two bands by exposed reach gives a figure to set beside the platform’s headline.
def reach_weighted(t, metric, bands, tag="reweighted"):    s = t[(t.metric == metric) & t.band.isin(bands)].set_index("band")    w = pd.Series({b: TRUE["exposed_reach"][b] for b in bands})    w = w / w.sum()    return float((w * s[f"{tag}_pts"]).sum()), float(math.sqrt(((w * s[f"{tag}_se"]) ** 2).sum()))

v, se = reach_weighted(lift, "awareness", ["18_24", "25_34"])v_raw, _ = reach_weighted(lift, "awareness", ["18_24", "25_34"], tag="unweighted")aware_1834 = fin.number(v, (v - 1.96 * se, v + 1.96 * se), aware_pts, label="Reweighted YouTube aided awareness lift, 18-34")print(f"unweighted 18-34 point: {v_raw:.2f} pts (biased low by non-response); true 18-34: " f"{(4.0 * 640 + 5.0 * 620) / 1260:.2f} pts")aware_1834unweighted 18-34 point: 0.65 pts (biased low by non-response); true 18-34: 4.49 pts
details
| means | aided awareness people per 100 exposed respondents in total, net from removing all spend, exposed, versus the control counterfactual, over 6 weeks, estimator point, 95% confidence |
|---|---|
| interval | 95% confidence 2.87 to 5.17 |
| trust level | 2 |
4. Fifteen tests, one correction: Benjamini-Hochberg
Section titled “4. Fifteen tests, one correction: Benjamini-Hochberg”Five metrics times three bands is 15 tests. At 5% each, about one null would look real by luck alone. BH keeps the false discovery rate at 5% (it holds under the positive dependence of questions answered by the same people).
Q = 0.05

def bh_keep(p, q=Q):    order = np.argsort(p)    passed = np.asarray(p)[order] <= q * np.arange(1, len(p) + 1) / len(p)    k = passed.nonzero()[0].max() + 1 if passed.any() else 0    keep = np.zeros(len(p), bool)    keep[order[:k]] = True    return keep

lift["raw_p_below_5pct"] = lift.p_value < 0.05lift["bh_keep"] = bh_keep(lift.p_value.to_numpy())kept = set(zip(lift[lift.bh_keep].metric, lift[lift.bh_keep].band))lift[["metric", "band", "reweighted_pts", "lo", "hi", "true_pts", "p_value", "raw_p_below_5pct", "bh_keep"]].round(4)| metric | band | reweighted_pts | lo | hi | true_pts | p_value | raw_p_below_5pct | bh_keep | |
|---|---|---|---|---|---|---|---|---|---|
| 0 | awareness | 18_24 | 2.8112 | 1.1845 | 4.4378 | 4.0 | 0.0007 | True | True |
| 1 | awareness | 25_34 | 5.2632 | 3.6434 | 6.8829 | 5.0 | 0.0000 | True | True |
| 2 | awareness | 35_plus | -0.0374 | -2.1601 | 2.0853 | 0.0 | 0.9725 | False | False |
| 3 | recall | 18_24 | 2.1556 | 0.9882 | 3.3230 | 3.0 | 0.0003 | True | True |
| 4 | recall | 25_34 | 3.3508 | 2.1755 | 4.5261 | 3.0 | 0.0000 | True | True |
| 5 | recall | 35_plus | 0.6101 | -0.8707 | 2.0909 | 0.0 | 0.4194 | False | False |
| 6 | consideration | 18_24 | 1.4815 | 0.5513 | 2.4117 | 1.5 | 0.0018 | True | True |
| 7 | consideration | 25_34 | 2.4076 | 1.4695 | 3.3457 | 2.0 | 0.0000 | True | True |
| 8 | consideration | 35_plus | 0.4559 | -0.7400 | 1.6519 | 0.0 | 0.4549 | False | False |
| 9 | favorability | 18_24 | 0.9215 | -0.7250 | 2.5681 | 0.0 | 0.2727 | False | False |
| 10 | favorability | 25_34 | 1.1102 | -0.5404 | 2.7608 | 0.0 | 0.1874 | False | False |
| 11 | favorability | 35_plus | 1.2267 | -0.9627 | 3.4161 | 0.0 | 0.2721 | False | False |
| 12 | intent | 18_24 | -0.3747 | -1.1735 | 0.4241 | 0.0 | 0.3579 | False | False |
| 13 | intent | 25_34 | 0.4842 | -0.3404 | 1.3088 | 0.0 | 0.2498 | False | False |
| 14 | intent | 35_plus | 0.3559 | -0.7450 | 1.4568 | 0.0 | 0.5263 | False | False |
BH keeps awareness, recall and consideration for 18-34 and drops every null. Honest caveat: consideration’s 1.5 to 2 points sit near the edge of what this survey can see. Rerunning the same design with other seeds shows how often BH gets this exact answer.
need = {("awareness", "18_24"), ("awareness", "25_34"), ("consideration", "18_24"), ("consideration", "25_34")}reruns = []for s in range(100, 112): t = lift_table(simulate(s)) t["bh_keep"] = bh_keep(t.p_value.to_numpy()) got = set(zip(t[t.bh_keep].metric, t[t.bh_keep].band)) reruns.append({"seed": s, "keeps_all_four": need <= got, "null_kept": bool((t.bh_keep & t.true_pts.eq(0)).any())})reruns = pd.DataFrame(reruns)print(f"BH kept all four awareness and consideration cells in {reruns.keeps_all_four.mean():.0%} of 12 reruns;" f" a null slipped through in {reruns.null_kept.mean():.0%}.")BH kept all four awareness and consideration cells in 75% of 12 reruns; a null slipped through in 8%.
5. From points to people per dollar (§25.10)
Section titled “5. From points to people per dollar (§25.10)”The conversion: people lifted = points lift / 100 × exposed reach, summed over bands; people per dollar = people lifted / spend. The interval comes from the band SEs (independent arms and bands), carried to the log scale.
One wording. This notebook reports people per dollar, the registry unit (higher is better). §25.10’s cost per person lifted is its reciprocal: dollars per person. Its interval is the reciprocal one, 1/hi to 1/lo.
Platform offset (proposed). §25.10 marks platform-run studies as self-measured: +0.25 on log cost per person lifted (so −0.25 on log people per dollar) and SE × 1.3. Both are placeholders until paired studies estimate them.
OFFSET, SE_INFLATE = 0.25, 1.3   # proposed (spec §25.10 placeholders)

def people_per_dollar(t, metric):    s = t[t.metric == metric].set_index("band")    reach, spend = pd.Series(TRUE["exposed_reach"]), TRUE["spend"]    value = float((s.reweighted_pts / 100 * reach).sum() / spend)    se = float(math.sqrt(((s.reweighted_se / 100 * reach) ** 2).sum()) / spend)    return value, se / value                     # value, SE on the log scale (delta method)

def log_interval(log_v, log_se):    return math.exp(log_v - 1.96 * log_se), math.exp(log_v + 1.96 * log_se)

consid = fin.estimand("E-BM-BRAND-CPLP-CONSID", channels="youtube", weeks=6)v, lse = people_per_dollar(lift, "awareness")ppd = fin.number(v, log_interval(math.log(v), lse), brand, label="YouTube aided awareness people per dollar")ppd_offset = fin.number(math.exp(math.log(v) - OFFSET), log_interval(math.log(v) - OFFSET, SE_INFLATE * lse), brand,                        label="YouTube aided awareness people per dollar, platform offset (proposed)")cv, clse = people_per_dollar(lift, "consideration")ppd_consid_offset = fin.number(math.exp(math.log(cv) - OFFSET), log_interval(math.log(cv) - OFFSET, SE_INFLATE * clse),                               consid, label="YouTube consideration people per dollar, platform offset (proposed)")TRUE_PPD = TRUE["people_lifted_per_$_awareness_true"]TRUE_PPD_CONSID = sum(TRUE["pp_lift"]["consideration"][b] / 100 * TRUE["exposed_reach"][b] for b in BANDS) / TRUE["spend"]
pd.DataFrame([{"number": n.label, "value": n.value, "lo": n.lo, "hi": n.hi, "truth": tv, "covers_truth": n.lo <= tv <= n.hi, "$ per person lifted": 1 / n.value, "$ lo": 1 / n.hi, "$ hi": 1 / n.lo, "estimand": n.estimand.words} for n, tv in ((ppd, TRUE_PPD), (ppd_offset, TRUE_PPD), (ppd_consid_offset, TRUE_PPD_CONSID))]).round(3)| number | value | lo | hi | truth | covers_truth | $ per person lifted | $ lo | $ hi | estimand | |
|---|---|---|---|---|---|---|---|---|---|---|
| 0 | YouTube aided awareness people per dollar | 0.241 | 0.180 | 0.322 | 0.270 | True | 4.153 | 3.101 | 5.561 | aided awareness people per dollar, net from removing all spend, exposed, versus the control counterfactual, over 6 weeks, estimator point, 95% confidence |
| 1 | YouTube aided awareness people per dollar, platform offset (proposed) | 0.188 | 0.128 | 0.274 | 0.270 | True | 5.332 | 3.648 | 7.794 | aided awareness people per dollar, net from removing all spend, exposed, versus the control counterfactual, over 6 weeks, estimator point, 95% confidence |
| 2 | YouTube consideration people per dollar, platform offset (proposed) | 0.093 | 0.060 | 0.144 | 0.105 | True | 10.766 | 6.929 | 16.727 | consideration people per dollar, net from removing all spend, exposed, versus the control counterfactual, over 6 weeks, estimator point, 95% confidence |
Before the offset the interval covers the truth (0.27). The offset pulls the point down and widens the band; here it still just covers. The truth in this simulation has no platform bias, so the offset is pure caution. On a real platform study nobody knows that, which is why the offset exists.
ppd_offsetdetails
| means | aided awareness people per dollar, net from removing all spend, exposed, versus the control counterfactual, over 6 weeks, estimator point, 95% confidence |
|---|---|
| interval | 95% confidence 0.13 to 0.27 |
| trust level | 2 |
6. Estimands for brand numbers: fin.compare across weeks and against ROI
Section titled “6. Estimands for brand numbers: fin.compare across weeks and against ROI”An older four-week YouTube study answers almost the same question. A sales ROI answers a different one.
brand_4wk = fin.estimand("E-BM-BRAND-CPLP", channels="youtube", weeks=4)pd.DataFrame([{"pair": name, "rung": a.rung, "combinable": a.combinable, "differs on": ", ".join(a.mismatched)} for name, a in (("6 weeks vs 4 weeks", fin.compare(brand, brand_4wk)), ("awareness vs consideration", fin.compare(brand, consid)), ("awareness vs sales ROI", fin.compare(brand, fin.estimand("roi"))))])| pair | rung | combinable | differs on | |
|---|---|---|---|---|
| 0 | 6 weeks vs 4 weeks | assumed_alignment | True | horizon |
| 1 | awareness vs consideration | side_by_side | False | unit |
| 2 | awareness vs sales ROI | side_by_side | False | intervention, baseline, horizon, unit, point_rule, interval, applies_to |
Six weeks against four is assumed_alignment: usable, with the assumption labelled and the interval widened.
Against ROI it is side_by_side: shown together, never combined.
7. Class E TestResult: excluded from sales calibration
Section titled “7. Class E TestResult: excluded from sales calibration”Back to Maya’s first plan. Babelfin has no TestResult wrapper, so this is a plain dict checked with
fin.check(..., operation="calibrate").
test_doc = {"channel": "youtube", "admissibility_class": "E", "method": "platform_reported", "estimand": brand.to_dict(), "lift": fin.number(4.2, (1.9, 6.5), brand).to_dict(), "outcome": "positive", "duration_weeks": 6, "provenance_tier": "platform-reported", "applies_to": {"media_ids": ["youtube"]}}fin.validate("test_result", test_doc)report_calibrate = fin.check("test_result", test_doc, operation="calibrate")report_calibrate.to_frame()| gate | outcome | message | codes | |
|---|---|---|---|---|
| 0 | G-EXP-01 | fallback | not pre-registered | NOT_PREREGISTERED |
G-EXP-05 excludes it and the run continues: survey brand lift never calibrates sales incrementality. G-EXP-01
adds that the study was not pre-registered.
For brand use, the result says which family it belongs to. Note: the gate reads a top-level metric_family
key on the result, not the one inside the estimand.
report_brand = fin.check("test_result", {**test_doc, "metric_family": "brand_awareness"}, operation="calibrate")report_brand.to_frame()| gate | outcome | message | codes | |
|---|---|---|---|---|
| 0 | G-EXP-01 | fallback | not pre-registered | NOT_PREREGISTERED |
8. brand_funnel Tier D manifest and m.check()
Section titled “8. brand_funnel Tier D manifest and m.check()”First the funnel: how much of the awareness lift carried down to consideration, per band (reweighted points).
pts = lift.set_index(["metric", "band"])rows = []for b in ["18_24", "25_34"]: a, sa = pts.loc[("awareness", b), ["reweighted_pts", "reweighted_se"]] c, sc = pts.loc[("consideration", b), ["reweighted_pts", "reweighted_se"]] r = c / a se = abs(r) * math.sqrt((sc / c) ** 2 + (sa / a) ** 2) # delta method, covariance set to 0 (assumed) rows.append({"band": b, "awareness": a, "consideration": c, "consideration_per_aware": r, "lo": r - 1.96 * se, "hi": r + 1.96 * se, "true_ratio": TRUE["pp_lift"]["consideration"][b] / TRUE["pp_lift"]["awareness"][b]})funnel = pd.DataFrame(rows).set_index("band")funnel["covers_truth"] = funnel.lo.le(funnel.true_ratio) & funnel.hi.ge(funnel.true_ratio)print("Lifts in", aware_pts.words.replace("aided awareness ", "<metric> "))print("Ratio: consideration points per awareness point, same band, 95% interval (delta method)")funnel.round(2)Lifts in <metric> people per 100 exposed respondents in total, net from removing all spend, exposed, versus the control counterfactual, over 6 weeks, estimator point, 95% confidence Ratio: consideration points per awareness point, same band, 95% interval (delta method)
| awareness | consideration | consideration_per_aware | lo | hi | true_ratio | covers_truth | |
|---|---|---|---|---|---|---|---|
| band | |||||||
| 18_24 | 2.81 | 1.48 | 0.53 | 0.08 | 0.98 | 0.38 | True |
| 25_34 | 5.26 | 2.41 | 0.46 | 0.23 | 0.68 | 0.40 | True |
The ratio of two noisy lifts is noisier still. For 18 to 24 it runs 0.08 to 0.98; for 25 to 34, 0.23 to 0.68. Both cover the truth (0.38, 0.40). Read it as a range, not a rate.
Why the covariance is set to 0. Both lifts come from the same respondents, so they likely move together. A positive covariance shrinks the ratio’s variance, so dropping it makes the interval wider: an assumption, labelled, on the cautious side.
Tier D summaries only take metric="roi" or "mroi", so the brand number sits under the roi label and the
estimand carries what it means. Meta’s figure is an illustrative one from a Q2 study on file, not re-analysed here.
Consideration goes in notes.
meta_ppd = fin.number(0.19, (0.12, 0.29), brand, label="Meta aided awareness people per dollar (Q2 study, on file)")m = fin.Model.from_table( {"youtube": ppd_offset, "meta": meta_ppd}, estimand=fin.estimand("E-BM-BRAND-CPLP", weeks=6), name="northwind_brand_funnel", engine="survey-funnel", family="brand_funnel", metric="roi", dependence="declared_assumption", notes=[{"code": "FUNNEL_CONSIDERATION", "estimand_id": "E-BM-BRAND-CPLP-CONSID", "youtube": ppd_consid_offset.to_dict()}, {"code": "PLATFORM_OFFSET_PROPOSED", "log_offset": OFFSET, "se_multiplier": SE_INFLATE}],)model_report = m.check()print(m, "|", model_report.next_state)model_report.to_frame()<Model 'northwind_brand_funnel' Tier D, 2 channels> | checks_passed
| gate | outcome | message | codes | |
|---|---|---|---|---|
| 0 | G-ACC-01 | fallback | acceptance untested: usable, labelled unvalidated method, trust reduced | UNVALIDATED_METHOD |
| 1 | G-CAP-01 | route | sandbox output: experimental label and a named approver needed | EXPERIMENTAL_LABEL |
Two labels, no stops. G-ACC-01: no acceptance run yet, so trust is reduced. G-CAP-01: a sandbox model needs
the experimental label and a named approver. Gap: no gate checks the §16 brand family bar (recovery, nulls);
this notebook’s truth checks stand in for it.
9. A benchmark row that stays client_only
Section titled “9. A benchmark row that stays client_only”The row stores log cost per person lifted (the benchmark convention), so the sign flips: offset +0.25 and SE
× 1.3. Babelfin has no wrapper; the typed model is ump_spec.models.BenchmarkEvidence and the kind is
benchmark_row. The study’s licence is client-only.
row = {"client_ref": "c_7f31a", "channel": "youtube", "vertical": "outdoor_retail", "quarter": "2026 Q3", "source_type": "brand_lift_platform", "estimand_id": "E-BM-BRAND-CPLP", "admissibility_class": "E", "log_value": -math.log(ppd.value) + OFFSET, "se": SE_INFLATE * lse, "metric_family": "brand_awareness", "licence": "client_only", "spend": float(TRUE["spend"]), "moderators": {"self_measured": True}, "notes": ["PLATFORM_OFFSET_PROPOSED"]}fin.validate("benchmark_row", row)bm_report = fin.check("benchmark_row", row)bm_report.to_frame()| gate | outcome | message | codes | |
|---|---|---|---|---|
| 0 | G-BM-07 | exclude_and_continue | held from pool: missing ['confidence_level', 'value_basis'] | HELD_FROM_POOL |
| 1 | G-BM-09 | fallback | licence client-only: kept out of pooled cells | LICENSE_CLIENT_ONLY |
G-BM-09 falls back to client_only: it still feeds Northwind’s own plans, never a cross-brand cell. G-BM-07
holds it from the pool for a second reason, a missing level and basis. Adding them clears that one.
bm_report_full = fin.check("benchmark_row", {**row, "confidence_level": 0.95, "value_basis": "net"})bm_report_full.to_frame()| gate | outcome | message | codes | |
|---|---|---|---|---|
| 0 | G-BM-09 | fallback | licence client-only: kept out of pooled cells | LICENSE_CLIENT_ONLY |
10. What Maya hands over
Section titled “10. What Maya hands over”- Asked: is the +4.2-point YouTube brand lift worth acting on, and can it calibrate the sales MMM?
- Calibration: no. Class E is excluded from sales calibration (
G-EXP-05); it is filed as brand evidence. - Handed over: below, with its estimand.
- Assumed or fell back: missing at random given arm, band and enthusiast; BH at 5% across 15 tests; the
§25.10 platform offset (0.25 log, SE × 1.3) is proposed; the model is Tier D, untested (
G-ACC-01), sandbox (G-CAP-01); the benchmark row is client-only. - Next: buy a 4-week independent panel read (class E, no platform offset) to check the offset, and size the next survey for consideration, which is near the edge of what this one could see.
pd.DataFrame([{"number": n.label, "value": round(n.value, 3), "interval": f"{n.lo:.3f} to {n.hi:.3f}", "level": n.level, "estimand": n.estimand.words} for n in (aware_1834, ppd, ppd_offset, ppd_consid_offset)])| number | value | interval | level | estimand | |
|---|---|---|---|---|---|
| 0 | Reweighted YouTube aided awareness lift, 18-34 | 4.018 | 2.870 to 5.166 | 0.95 | aided awareness people per 100 exposed respondents in total, net from removing all spend, exposed, versus the control counterfactual, over 6 weeks, estimator point, 95% confidence |
| 1 | YouTube aided awareness people per dollar | 0.241 | 0.180 to 0.322 | 0.95 | aided awareness people per dollar, net from removing all spend, exposed, versus the control counterfactual, over 6 weeks, estimator point, 95% confidence |
| 2 | YouTube aided awareness people per dollar, platform offset (proposed) | 0.188 | 0.128 to 0.274 | 0.95 | aided awareness people per dollar, net from removing all spend, exposed, versus the control counterfactual, over 6 weeks, estimator point, 95% confidence |
| 3 | YouTube consideration people per dollar, platform offset (proposed) | 0.093 | 0.060 to 0.144 | 0.95 | consideration people per dollar, net from removing all spend, exposed, versus the control counterfactual, over 6 weeks, estimator point, 95% confidence |
Going deeper
Section titled “Going deeper”- §25.10 of the spec: metric families, the platform offset and licences. §6 of the spec: admissibility classes.
ump_spec.models.TestResult,BenchmarkEvidenceandModelManifesthold the full contract.- The registry titles brand estimands cost per person lifted while the unit reads people per dollar; this notebook uses the unit and gives the reciprocal.
Next: 01 · Estimands and shown numbers for estimands from the start, or 02 · Validate and gate a document offline for more on gates.