14 · Platform ROAS says 6x, MMM says 1.5x: triangulating with lift
You will learn
- See why attributed ROAS, MMM ROI and lift iROAS answer different questions
- Keep class A and B lift tests and exclude class D
- Derive a multiplier per channel with a Fieller interval
- Know where a "divide platform ROAS by N" rule stops working
You need
- Python 3.12 and uv
- Notebook 11 helps but is not required
Runs offline. Uses babelfin (import babelfin as fin), NumPy, pandas and scikit-learn. The data is SYNTHETIC,
generated below with a known truth.
Northwind Outdoor’s CFO has three numbers for paid social on one slide. The platform dashboard says 6.1x. The agency MMM says 1.5x. Last spring’s conversion-lift test said 2.3x. She asks Li Wei, on the planning team, which one to believe before next quarter’s budget.
Li’s first instinct is to average them. This notebook shows why UMP will not let that happen silently, what Li does instead, and the one-line rule she hands back: divide platform ROAS by a per-channel multiplier, and here is how wide that answer is.
import itertools
import babelfin as finimport matplotlib.pyplot as pltimport numpy as npimport pandas as pdfrom sklearn.linear_model import Ridge
SEED = 14CHANNELS = ["search", "social", "display"]pd.set_option("display.max_colwidth", None)   # an estimand is a sentence; never cut it short

def table(numbers, truth=None):    """fin.Numbers as rows: value, interval, the estimand in words and (optionally) the truth."""    rows = []    for name, n in numbers.items():        row = {"number": name, "value": n.value, "lo": n.lo, "hi": n.hi, "level": n.level}        if truth is not None:            row["TRUE"] = truth[name]            row["covered"] = n.lo <= truth[name] <= n.hi        rows.append({**row, "estimand": n.estimand.words})    return pd.DataFrame(rows).round(2)
1. Three numbers for paid social and the urge to average
Section titled “1. Three numbers for paid social and the urge to average”Here are the slide’s numbers, each with the estimand Li could reconstruct from its source. The platform gave no interval, so its band is imputed and labelled (G-UNC-01, proposed width).
attr_q = fin.estimand("roi", channels="social", weeks=1, kpi="attributed_revenue", point_rule="estimator_point",                      interval="bootstrap_pct")            # 7-day click window, credit by last touchmmm_q = fin.estimand("E-MMM-ROI", channels="social")       # plan-year ROI, total to decaylift_q = fin.estimand("E-USER-ITT", channels="social", kpi="revenue", weeks=6)   # 4-week test + 2-week post window
slide = { "platform (7-day click)": fin.imputed_number(6.1, attr_q, label="Social platform ROAS"), "agency MMM": fin.number(1.5, (1.0, 2.1), mmm_q, label="Social MMM ROI"), "conversion-lift test": fin.number(2.3, (1.6, 3.0), lift_q, label="Social lift iROAS"),}table(slide)| number | value | lo | hi | level | estimand | |
|---|---|---|---|---|---|---|
| 0 | platform (7-day click) | 6.1 | 3.05 | 9.15 | 0.9 | attributed revenue per dollar, net from removing all spend, geo_set, versus zero spend, over 1 weeks, estimator point, 90% bootstrap_pct |
| 1 | agency MMM | 1.5 | 1.00 | 2.10 | 0.9 | revenue per dollar, net from removing all spend, geo_set, versus zero spend, total including carryover, posterior median, 90% eti |
| 2 | conversion-lift test | 2.3 | 1.60 | 3.00 | 0.9 | revenue per dollar, net from removing all spend, itt, versus the control counterfactual, over 6 weeks, estimator point, 90% confidence |
naive = np.mean([n.value for n in slide.values()])print(f"Li's average: {naive:.2f}x (a number with no estimand: what question does it answer?)")Li's average: 3.30x (a number with no estimand: what question does it answer?)
Li stops before sending it. The three numbers count different things over different windows: credited revenue in 7 days, modelled revenue over the plan year, and measured incremental revenue over 6 weeks. An average of them answers none of those questions. Section 5 shows UMP’s answer; first, a world where we know the truth.
2. A synthetic world with known iROAS and attribution inflation
Section titled “2. A synthetic world with known iROAS and attribution inflation”Two years of weekly spend on search, social and display. Each channel causes some revenue (its true iROAS, with carryover for social and display). Most revenue is organic. The platforms still claim a lot of it:
- Branded search harvests demand. People who already meant to buy type “northwind boots” and click an ad.
- Retargeting selects buyers. Social and display chase people who are already in the basket.
Paths are simulated per conversion and credited by last touch. The touch rates are tuned so the dashboard shows the slide’s ROAS, so the truth includes how inflated each channel’s attribution is.
TRUE = {"iroas": {"search": 0.9, "social": 2.2, "display": 0.6},        "attr_inflation": {"search": 5.5, "social": 2.7, "display": 3.0},        "platform_roas_reported": {"search": 5.0, "social": 6.1, "display": 1.8},        "window_days": {"attr": 7, "lift": 42, "mmm": 364}}# attr_inflation is rounded; the exact ratio the world is built to is reported / iROASTRUE_MULT = {c: TRUE["platform_roas_reported"][c] / TRUE["iroas"][c] for c in CHANNELS}
WEEKS, PLAN = 104, slice(52, 104)          # two years of history; the plan year is the secondAOV = 80.0                                  # revenue per conversionDECAY = {"search": 0.0, "social": 0.4, "display": 0.3}LATE = {"search": 2.0, "social": 1.0, "display": 0.6}   # how close to purchase each channel's touch tends to land
rng = np.random.default_rng(SEED)week = np.arange(WEEKS)spend = pd.DataFrame({"search": rng.gamma(20, 2_000, WEEKS), "social": rng.gamma(8, 3_750, WEEKS),                      "display": rng.gamma(6, 2_500, WEEKS)})

def adstock(x, decay):    out = np.zeros(len(x))    for t, v in enumerate(x):        out[t] = v + (decay * out[t - 1] if t else 0.0)    return out * (1 - decay)               # normalised: a dollar's total effect is its iROAS

organic = 550_000 + 90_000 * np.sin(2 * np.pi * week / 52) + rng.normal(0, 30_000, WEEKS)incremental = pd.DataFrame({c: TRUE["iroas"][c] * adstock(spend[c].to_numpy(), DECAY[c]) for c in CHANNELS})sales = organic + incremental.sum(axis=1).to_numpy()print(f"plan-year spend ${spend[PLAN].sum().sum() / 1e6:.2f}M; revenue ${sales[PLAN].sum() / 1e6:.1f}M, " f"of which incremental to paid media {incremental[PLAN].sum().sum() / sales[PLAN].sum():.0%}")plan-year spend $4.42M; revenue $34.3M, of which incremental to paid media 17%
Why tune the touch rates? The expected last-touch credit has a closed form (the latest of independent touches
with time CDF x**a is channel c with probability a_c / sum(a)), so a few fixed-point steps find the touch rates
that make the dashboard read 5.0x, 6.1x and 1.8x. Then the paths are drawn at random.
def expected_roas(touch):    a = np.array([LATE[c] for c in CHANNELS])    p = np.array([touch[c] for c in CHANNELS])    volume = {"organic": organic[PLAN].sum(), **{c: incremental[c][PLAN].sum() for c in CHANNELS}}    credit = np.zeros(3)    for src, v in volume.items():        for s in map(np.array, itertools.product([0, 1], repeat=3)):            forced = CHANNELS.index(src) if src != "organic" else None            if forced is not None and not s[forced]:                continue            prob = np.prod([p[i] if s[i] else 1 - p[i] for i in range(3) if i != forced])            if s.any():                credit += v * prob * s * a / (s * a).sum()    return {c: credit[i] / spend[c][PLAN].sum() for i, c in enumerate(CHANNELS)}

touch = {c: 0.2 for c in CHANNELS}for _ in range(200): r = expected_roas(touch) touch = {c: float(np.clip(touch[c] * (TRUE["platform_roas_reported"][c] / r[c]) ** 0.5, 0, 0.99)) for c in CHANNELS}{c: round(v, 3) for c, v in touch.items()} # share of conversions each channel touches on the way{'search': 0.311, 'social': 0.297, 'display': 0.057}3. Last-touch attribution from simulated paths
Section titled “3. Last-touch attribution from simulated paths”Every conversion gets a path: the channel that caused it (if any) plus whichever channels happened to touch it. The latest touch takes the credit. That is the platform’s number, rebuilt.
def last_touch_week(w, rng, org=organic, inc=incremental):    counts = {"organic": rng.poisson(org[w] / AOV), **{c: rng.poisson(inc[c][w] / AOV) for c in CHANNELS}}    credit = dict.fromkeys(CHANNELS, 0.0)    for src, n in counts.items():        touched = np.column_stack([rng.random(n) < touch[c] for c in CHANNELS])        if src != "organic":            touched[:, CHANNELS.index(src)] = True          # the causing channel is always on the path        when = np.where(touched, np.column_stack([rng.beta(LATE[c], 1, n) for c in CHANNELS]), -1.0)        last = when.argmax(axis=1)        for i, c in enumerate(CHANNELS):            credit[c] += AOV * ((last == i) & touched.any(axis=1)).sum()    return credit

path_rng = np.random.default_rng(SEED + 1)attributed = pd.DataFrame([last_touch_week(w, path_rng) for w in range(WEEKS)])attributed[PLAN].sum().div(spend[PLAN].sum()).round(2).rename("attributed ROAS, plan year")search 5.01 social 6.07 display 1.79 Name: attributed ROAS, plan year, dtype: float64
Intervals come from a bootstrap over plan-year weeks. They are narrow: the platform counts its own credit very precisely. Precision is not the problem.
boot_rng = np.random.default_rng(SEED + 2)idx = boot_rng.integers(52, WEEKS, size=(2_000, 52))attr_draws = pd.DataFrame({c: attributed[c].to_numpy()[idx].sum(1) / spend[c].to_numpy()[idx].sum(1) for c in CHANNELS})attr_q_all = fin.estimand(attr_q, channels=CHANNELS)platform = {c: fin.number(attr_draws[c].median(), tuple(attr_draws[c].quantile([0.05, 0.95])), fin.estimand(attr_q, channels=c), label=f"{c} attributed ROAS") for c in CHANNELS}table(platform)| number | value | lo | hi | level | estimand | |
|---|---|---|---|---|---|---|
| 0 | search | 5.01 | 4.76 | 5.29 | 0.9 | attributed revenue per dollar, net from removing all spend, geo_set, versus zero spend, over 1 weeks, estimator point, 90% bootstrap_pct |
| 1 | social | 6.06 | 5.67 | 6.47 | 0.9 | attributed revenue per dollar, net from removing all spend, geo_set, versus zero spend, over 1 weeks, estimator point, 90% bootstrap_pct |
| 2 | display | 1.79 | 1.66 | 1.94 | 0.9 | attributed revenue per dollar, net from removing all spend, geo_set, versus zero spend, over 1 weeks, estimator point, 90% bootstrap_pct |
As a manifest this is a Tier D attribution model. Its channels are credited separately and nothing ties their
errors together, so dependence="per_channel".
last_touch = fin.Model.from_table(platform, estimand=attr_q_all, name="nw_last_touch", engine="last-touch", family="attribution", metric="roi", dependence="per_channel", client="northwind-outdoor")report = last_touch.check()print(report.ok, report.next_state)report.to_frame()True checks_passed
| gate | outcome | message | codes | |
|---|---|---|---|---|
| 0 | G-ACC-01 | fallback | acceptance untested: usable, labelled unvalidated method, trust reduced | UNVALIDATED_METHOD |
| 1 | G-CAP-01 | route | sandbox output: experimental label and a named approver needed | EXPERIMENTAL_LABEL |
G-ACC-01 labels it an unvalidated method (no acceptance record yet) and G-CAP-01 routes the sandbox output. The
"roi" label is the only Tier D slot (roi or mroi); the estimand says it is attributed revenue. The spec’s
§16 attribution check, “agreement with tests”, has no gate, so Li runs it by hand in section 6.
4. Lift tests as TestResults: classes A and B kept, class D excluded
Section titled “4. Lift tests as TestResults: classes A and B kept, class D excluded”Three tests, taken as given summaries (90% intervals):
- Search, class A. Northwind’s own geo holdout, branded and generic search paused in matched markets.
- Social, class B. The platform’s conversion-lift holdout from last spring (randomised at user level).
- Display, class D. A platform “A/B” of two creatives. Delivery diverged between arms, so it never calibrates.
babelfin has no TestResult wrapper, so these are plain dicts checked with fin.check("test_result", ...).
search_q = fin.estimand("E-GEO-IROAS", channels="search", weeks=6)display_q = fin.estimand("E-USER-ITT", channels="display", kpi="revenue", weeks=6)

def test_result(channel, cls, method, number, provenance):    return {"channel": channel, "admissibility_class": cls, "method": method, "estimand": number.estimand.to_dict(),            "iroas": number.to_dict(), "outcome": "positive", "preregistered": cls in "AB", "duration_weeks": 4,            "carryover_floor_weeks": 2, "provenance_tier": provenance, "applies_to": {"media_ids": [channel]}}

lift = {"search": fin.number(0.95, (0.62, 1.28), search_q, label="search geo iROAS"),        "social": fin.number(2.3, (1.6, 3.0), lift_q, label="social lift iROAS"),        "display": fin.number(1.4, (1.1, 1.7), display_q, label="display A/B 'iROAS'")}tests = {"search": test_result("search", "A", "trimmed_match", lift["search"], "own-experimental"),         "social": test_result("social", "B", "itt", lift["social"], "platform-reported"),         "display": test_result("display", "D", "platform_ab", lift["display"], "platform-reported")}
checks = {c: fin.check("test_result", doc, operation="calibrate") for c, doc in tests.items()}pd.DataFrame([{"channel": c, "class": tests[c]["admissibility_class"], "ok": r.ok, "gates": ", ".join(sorted({g.gate_id for g in r.results if g.outcome not in ("pass", "computed")})) or "none", "kept": not any(g.outcome == "exclude_and_continue" for g in r.results)} for c, r in checks.items()])| channel | class | ok | gates | kept | |
|---|---|---|---|---|---|
| 0 | search | A | True | none | True |
| 1 | social | B | True | none | True |
| 2 | display | D | True | G-EXP-01, G-EXP-05 | False |
checks["display"].to_frame()| gate | outcome | message | codes | |
|---|---|---|---|---|
| 0 | G-EXP-05 | exclude_and_continue | excluded from calibration: ['display'] (class D/E or contaminated) | EVIDENCE_EXCLUDED |
| 1 | G-EXP-01 | fallback | not pre-registered | NOT_PREREGISTERED |
Display’s only test is excluded and the run continues. Display will have no multiplier; section 7 says what the CFO gets instead.
5. Why the numbers do not line up
Section titled “5. Why the numbers do not line up”fin.compare walks the G-EST-02 ladder: match, converter, re-ask, assumed alignment (widened), side by side.
Platform against lift first. The KPI differs (credited revenue against incremental revenue), and so do the window (7 days against 42) and the baseline (no counterfactual against a holdout). There is no defensible alignment.
platform_vs_lift = fin.compare(platform["social"], lift["social"])print(platform_vs_lift.explain())platform_vs_lift.to_frame()rung: side_by_side (KPI, unit or scope differ) fields that differ: intervention, baseline, horizon, unit, interval G-EST-02 ESTIMAND_ALIGNED: no defensible alignment; numbers shown side by side, not combined
| field | first | second | |
|---|---|---|---|
| 0 | intervention | type remove_all, size -1.0, size_kind relative, arms , population geo_set | type remove_all, size -1.0, size_kind relative, arms holdout, population itt |
| 1 | baseline | zero_spend | control_counterfactual |
| 2 | horizon | type window, weeks 1 | type window, weeks 6 |
| 3 | unit | kpi attributed_revenue, per spend, cost_basis net, currency USD | kpi revenue, per spend, cost_basis net, currency USD |
| 4 | interval | method bootstrap_pct, level 0.9 | method confidence, level 0.9 |
MMM against lift is closer: both count incremental revenue. The horizon (total to decay against a 6-week window)
and the intervention still differ, so UMP assumes alignment and widens the interval to cover both. The MMM is the
model here (a_is_model=True), but a notebook cannot re-ask it, so the ladder skips that rung.
mmm_vs_lift = fin.compare(slide["agency MMM"], lift["social"], a_is_model=True)print(mmm_vs_lift.explain())print("widened interval:", mmm_vs_lift.interval)mmm_vs_lift.to_frame()rung: assumed_alignment (mismatch limited to assumable fields) fields that differ: intervention, baseline, horizon, point_rule, interval G-EST-02 ESTIMAND_ALIGNED: the two estimands answer the same question after alignment; interval widened to the envelope across plausible alignments interval after alignment: 1.00 to 3.00 widened interval: lo=1.0 hi=3.0 level=0.9 method='envelope' segments=None
| field | first | second | |
|---|---|---|---|
| 0 | intervention | type remove_all, size -1.0, size_kind relative, arms , population geo_set | type remove_all, size -1.0, size_kind relative, arms holdout, population itt |
| 1 | baseline | zero_spend | control_counterfactual |
| 2 | horizon | type total_to_decay, threshold 0.05 | type window, weeks 6 |
| 3 | point_rule | posterior_median | estimator_point |
| 4 | interval | method eti, level 0.9 | method confidence, level 0.9 |
Going into a sealed budget decision, the CFO’s office runs strict. Then assumed alignment is a stop, not a label.
try: fin.compare(slide["agency MMM"], lift["social"], a_is_model=True, strict=True)except fin.Stopped as stop: print(stop.code, "-", stop.detail)ESTIMAND_ALIGNED - estimands differ on ['intervention', 'baseline', 'horizon', 'point_rule', 'interval']; strict mode stops at assumed_alignment
Li’s own MMM, as a Tier D summary
Section titled “Li’s own MMM, as a Tier D summary”For a fair side-by-side Li refits a small ridge MMM on the same synthetic weeks (decays fixed at the agency’s settings, moving-block bootstrap for intervals). Notebook 06 has the full MMM workflow; here only the summary travels.
X = np.column_stack([adstock(spend[c].to_numpy(), DECAY[c]) for c in CHANNELS]                    + [np.sin(2 * np.pi * week / 52), np.cos(2 * np.pi * week / 52)])

def ridge_roi(rows):    sd = X[rows].std(0)    coef = Ridge(alpha=10.0).fit(X[rows] / sd, sales[rows]).coef_ / sd    return coef[:3]   # adstock is normalised, so a coefficient is the ROI

mmm_rng = np.random.default_rng(SEED + 3)blocks = [np.concatenate([np.arange(s, s + 8) for s in mmm_rng.integers(0, WEEKS - 8, 14)])[:WEEKS] for _ in range(400)]mmm_draws = pd.DataFrame([ridge_roi(b) for b in blocks], columns=CHANNELS)mmm = {c: fin.number(mmm_draws[c].median(), tuple(mmm_draws[c].quantile([0.05, 0.95])), fin.estimand(mmm_q, channels=c, interval="bootstrap_pct", point_rule="estimator_point"), label=f"{c} MMM ROI") for c in CHANNELS}table(mmm, truth=TRUE["iroas"])| number | value | lo | hi | level | TRUE | covered | estimand | |
|---|---|---|---|---|---|---|---|---|
| 0 | search | 0.38 | -0.11 | 0.91 | 0.9 | 0.9 | True | revenue per dollar, net from removing all spend, geo_set, versus zero spend, total including carryover, estimator point, 90% bootstrap_pct |
| 1 | social | 2.01 | 1.26 | 2.75 | 0.9 | 2.2 | True | revenue per dollar, net from removing all spend, geo_set, versus zero spend, total including carryover, estimator point, 90% bootstrap_pct |
| 2 | display | 0.82 | -0.27 | 1.72 | 0.9 | 0.6 | True | revenue per dollar, net from removing all spend, geo_set, versus zero spend, total including carryover, estimator point, 90% bootstrap_pct |
Ridge shrinks toward zero, so search and social come in under the truth, the same direction as the agency’s 1.5x. All three intervals cover the truth, but search’s and display’s reach below zero: an MMM alone cannot tell the CFO much about them.
6. Multipliers per channel, with intervals
Section titled “6. Multipliers per channel, with intervals”The multiplier is a ratio: attributed ROAS (7-day last touch, plan year) divided by lift iROAS (6-week test window). Li keeps it only for channels with an admissible test. Its estimand is the attribution estimand re-wrapped, with the unit naming the lift test as the denominator. The interval is Fieller’s, which stays honest when the denominator is uncertain: if the test’s interval reached zero, the multiplier would be unbounded and Fieller would say so.
Z = 1.6449   # 90%

def fieller(num, se_num, den, se_den, z=Z):    """Fieller interval for num/den with independent errors; None when the denominator is not bounded away from 0."""    g = (z * se_den / den) ** 2    if g >= 1:        return None    r = num / den    half = z / (den * (1 - g)) * np.sqrt(se_num**2 + r**2 * se_den**2 - g * se_num**2)    return (r / (1 - g) - half, r / (1 - g) + half)

# a ratio, re-wrapped from the attribution estimand; per= is free text, so it names the denominator in wordsmult_q = fin.estimand(attr_q, kpi="attributed_revenue_per_6wk_lift_revenue", per="absolute", interval="confidence")kept = [c for c in CHANNELS if not any(g.outcome == "exclude_and_continue" for g in checks[c].results)]multiplier = {}for c in kept: num, se_num = platform[c].value, attr_draws[c].std() den, se_den = lift[c].value, (lift[c].hi - lift[c].lo) / (2 * Z) lo, hi = fieller(num, se_num, den, se_den) multiplier[c] = fin.number(num / den, (lo, hi), fin.estimand(mult_q, channels=c), label=f"{c} multiplier")table(multiplier, truth=TRUE["attr_inflation"])| number | value | lo | hi | level | TRUE | covered | estimand | |
|---|---|---|---|---|---|---|---|---|
| 0 | search | 5.28 | 3.89 | 8.11 | 0.9 | 5.5 | True | attributed revenue per 6wk lift revenue in total, net from removing all spend, geo_set, versus zero spend, over 1 weeks, estimator point, 90% confidence |
| 1 | social | 2.63 | 2.00 | 3.81 | 0.9 | 2.7 | True | attributed revenue per 6wk lift revenue in total, net from removing all spend, geo_set, versus zero spend, over 1 weeks, estimator point, 90% confidence |
Both intervals cover the true inflation. Search’s is the largest by far: branded search is mostly credited for sales that were coming anyway. Display is not in the table; its only test was excluded.
Why not fin.total here? Multipliers are ratios; they do not add. fin.total does not check the estimand and
would sum them without complaint, so it is not used on ratios.
fig, ax = plt.subplots(figsize=(7, 2.2))for i, c in enumerate(kept): n = multiplier[c] ax.plot([n.lo, n.hi], [i, i], lw=6, solid_capstyle="butt", color="#7a9cc6") ax.plot(n.value, i, "k|", ms=14) ax.plot(TRUE["attr_inflation"][c], i, "rx", ms=9)ax.set_yticks(range(len(kept)), kept)ax.set_xlabel("attributed ROAS per $1 of lift-measured return (90% Fieller); x = truth")plt.tight_layout()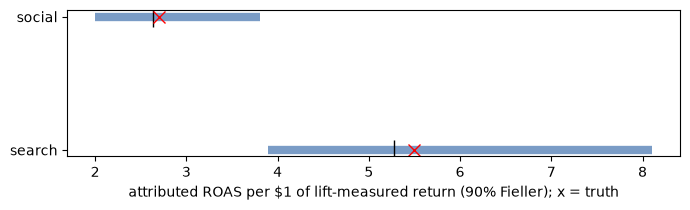
The §16 check, by hand: agreement with tests
Section titled “The §16 check, by hand: agreement with tests”Does attributed ROAS agree with the tests as a measure of incrementality? For both tested channels the intervals do not even overlap. Li records that in the manifest’s acceptance block. A failed bar is excluded (G-ACC-01): platform ROAS cannot stand in for iROAS on its own. It survives only through the multiplier.
agree = {c: bool(platform[c].lo <= lift[c].hi and lift[c].lo <= platform[c].hi) for c in kept}acceptance = {"status": "failed", "decisions": {"status": "failed", "metrics": {"check": "spec 16 attribution: agreement with tests (by hand)", "intervals_overlap": agree, "multiplier": {c: round(multiplier[c].value, 2) for c in kept}}}}last_touch_checked = fin.Model.from_table(platform, estimand=attr_q_all, name="nw_last_touch", engine="last-touch", family="attribution", metric="roi", dependence="per_channel", client="northwind-outdoor", acceptance=acceptance)last_touch_checked.check().to_frame()| gate | outcome | message | codes | |
|---|---|---|---|---|
| 0 | G-ACC-01 | exclude_and_continue | acceptance bar failed: excluded; next-best capability or library benchmarks | EVIDENCE_EXCLUDED |
| 1 | G-CAP-01 | route | sandbox output: experimental label and a named approver needed | EXPERIMENTAL_LABEL |
7. The CFO rule, and where it stops working
Section titled “7. The CFO rule, and where it stops working”Lift-equivalent iROAS ≈ platform ROAS ÷ multiplier.
The real test is a dashboard the multiplier never saw. Li simulates next year from the same world: fresh spend, fresh organic noise, fresh paths, the same true iROAS and touch rates. The dashboard is read as exact, so the interval comes from the multiplier alone.
Why a whole year? Organic demand is seasonal and the multiplier was fit on a full year. A single quarter’s dashboard drifts with the season, so it needs a multiplier fit on the same quarter.
# next year, same world: the truth does not move, so TRUE still scores the ruleny_rng = np.random.default_rng(SEED + 4)week_ny = np.arange(WEEKS, WEEKS + 52)spend_ny = pd.DataFrame({"search": ny_rng.gamma(20, 2_000, 52), "social": ny_rng.gamma(8, 3_750, 52),                         "display": ny_rng.gamma(6, 2_500, 52)})spend_all = pd.concat([spend, spend_ny], ignore_index=True)       # adstock carries over from this yearorganic_ny = 550_000 + 90_000 * np.sin(2 * np.pi * week_ny / 52) + ny_rng.normal(0, 30_000, 52)incremental_ny = pd.DataFrame({c: TRUE["iroas"][c] * adstock(spend_all[c].to_numpy(), DECAY[c])[WEEKS:]                               for c in CHANNELS})attributed_ny = pd.DataFrame([last_touch_week(w, ny_rng, organic_ny, incremental_ny) for w in range(52)])next_year = attributed_ny.sum().div(spend_ny.sum())                # next year's 7-day last-touch dashboardprint("next year's dashboard:", next_year.round(2).to_dict())
rule_q = {c: fin.estimand(lift[c].estimand, kpi="revenue") for c in kept}cfo = {c: fin.number(next_year[c] / multiplier[c].value, (next_year[c] / multiplier[c].hi, next_year[c] / multiplier[c].lo), rule_q[c], label=f"{c} iROAS from the platform rule") for c in kept}table(cfo, truth=TRUE["iroas"])next year's dashboard: {'search': 5.05, 'social': 6.29, 'display': 1.73}
| number | value | lo | hi | level | TRUE | covered | estimand | |
|---|---|---|---|---|---|---|---|---|
| 0 | search | 0.96 | 0.62 | 1.30 | 0.9 | 0.9 | True | revenue per dollar, net from adding spend, geo_set, versus the control counterfactual, over 6 weeks, estimator point, 90% confidence |
| 1 | social | 2.39 | 1.65 | 3.14 | 0.9 | 2.2 | True | revenue per dollar, net from removing all spend, itt, versus the control counterfactual, over 6 weeks, estimator point, 90% confidence |
Where it stops working:
- Display. No admissible test, so no multiplier. The CFO gets “not available” from this rule; the next rung is the MMM summary above (warned) or a benchmark (warned). A class A holdout on display is the cheapest fix.
- When targeting changes. The multiplier holds only while retargeting share and branded-search demand stay put. A new audience strategy is a new multiplier, and the test results carry a use-by date for that reason.
- Other windows. The multiplier converts 7-day last-touch to 6-week lift. A 28-day view-through dashboard needs its own test pair.
naive_err = naive - TRUE["iroas"]["social"]print(f"naive average {naive:.2f}x vs TRUE social iROAS {TRUE['iroas']['social']}x: off by {naive_err:+.2f}" f" ({naive_err / TRUE['iroas']['social']:+.0%})")print(f"rule on next year's dashboard: {cfo['social'].value:.2f}x (90% {cfo['social'].lo:.2f} to {cfo['social'].hi:.2f}) " f"vs TRUE {TRUE['iroas']['social']}x")naive average 3.30x vs TRUE social iROAS 2.2x: off by +1.10 (+50%) rule on next year's dashboard: 2.39x (90% 1.65 to 3.14) vs TRUE 2.2x
for n in [*multiplier.values(), cfo["social"]]: print(f"{n.label}: {n.value:.2f} (90% {n.lo:.2f} to {n.hi:.2f})") print(" estimand:", n.estimand.words)search multiplier: 5.28 (90% 3.89 to 8.11)
estimand: attributed revenue per 6wk lift revenue in total, net from removing all spend, geo_set, versus zero spend, over 1 weeks, estimator point, 90% confidence
social multiplier: 2.63 (90% 2.00 to 3.81)
estimand: attributed revenue per 6wk lift revenue in total, net from removing all spend, geo_set, versus zero spend, over 1 weeks, estimator point, 90% confidence
social iROAS from the platform rule: 2.39 (90% 1.65 to 3.14)
estimand: revenue per dollar, net from removing all spend, itt, versus the control counterfactual, over 6 weeks, estimator point, 90% confidence
Summary
Section titled “Summary”- Asked: which paid-social return should the CFO believe, and how to read platform ROAS from here on.
- Handed over: a multiplier per tested channel (attributed 7-day last-touch ROAS per dollar of lift-measured 6-week iROAS, 90% Fieller interval), and the rule iROAS ≈ platform ROAS ÷ multiplier. The cell above prints each with its estimand; both multiplier intervals cover the true inflation. Applied to a fresh simulated year’s dashboard (social 6.29x, same world), the rule gives social 2.39x iROAS (90% 1.65 to 3.14), which covers the true 2.2x where Li’s 3.3x average missed by half.
- Assumed or fell back: the rule reads the dashboard as exact and holds only while the world stays put; the platform’s own 6.1x had no interval (imputed, G-UNC-01); MMM against lift is an assumed alignment with a widened interval (G-EST-02), and a strict stop; platform against lift goes side by side; display’s class D test is excluded (G-EXP-05), so display has no multiplier; the attribution model fails the §16 agreement check (G-ACC-01, excluded on its own) and is used only through the multiplier.
- Next: a class A holdout on display, and a re-test of social before the multiplier’s use-by date or any change to retargeting.
Going deeper
Section titled “Going deeper”- The estimands that would not align are in
platform_vs_lift.to_frame()andmmm_vs_lift.to_frame(). - The contract objects are one step away:
multiplier["social"].spec(aShownNumber),last_touch.spec(aModelManifest),checks["display"].results. - Fieller’s interval treats the platform and test errors as independent. They come from different data, so that is reasonable here; a test read from the same platform’s logs would need the covariance.
Next: 06 · scikit-learn pipelines and business questions for the full MMM workflow behind a Tier D summary.