03 · From a pandas workflow to a UMP model
You will learn
- Record pandas prep as a replayable recipe
- Put bootstrap intervals on a plain NumPy regression
- Package the answers as a model and gate it locally
You need
- Python 3.12 and uv
- The SYNTHETIC files in packages/finprint/examples/synthetic_data
Runs offline. Uses babelfin and the SYNTHETIC files shipped with
packages/finprint/examples/synthetic_data (seed 7, not client data).
Priya’s usual Friday: open the weekly file in a notebook, clean it, build a few features, fit a quick regression and paste the ROIs into a slide. On Monday someone asks “which file was that, and what did you do to it?” and she cannot quite say. Then finance compares her TV ROI with the agency’s and the two do not agree, because one is an average return and the other is a last-dollar return.
This notebook keeps her workflow (pandas and NumPy all the way) and adds three small habits:
- record the prep, so the cleaned file carries a replayable recipe;
- say what the numbers mean, with an interval on each;
- package the result as a model and run the gates before anyone sees it.
%load_ext finprintfrom pathlib import Path
import babelfin as finimport finprint as fpimport matplotlib.pyplot as pltimport numpy as npimport pandas as pd
DATA = Path("../packages/finprint/examples/synthetic_data")OUT = Path("out")OUT.mkdir(exist_ok=True)CHANNELS = ["tv", "social", "search"]
1. Prepare the data, with a recipe
Section titled “1. Prepare the data, with a recipe”fin.record starts a recording. Everything after it is ordinary pandas: each step is recorded with its row
counts, and functions marked @rec.step are recorded with their source so they replay.
rec = fin.record("northwind weekly model prep (synthetic data)")raw = rec.read_csv(DATA / "northwind_raw.csv", parse_dates=["week"])promos = rec.read_csv(DATA / "promo_calendar.csv", parse_dates=["week"])
clean = raw.drop(index=[12, 13])            # the client feed double-counted these weeksclean["tv"] = clean["tv"].interpolate()     # one missing TV weekclean = clean.merge(promos, on="week", how="left")clean = clean.fillna({"promo": 0, "promo_name": "none"})clean = clean.reset_index(drop=True)

@rec.stepdef add_seasonality(df, period_weeks=52):    out = df.copy()    t = (out["week"] - out["week"].min()).dt.days / 7.0    out["season_sin"] = np.sin(2 * np.pi * t / period_weeks)    out["season_cos"] = np.cos(2 * np.pi * t / period_weeks)    out["trend"] = t / period_weeks    return out

features = add_seasonality(clean, period_weeks=52)saved = rec.save(features, OUT / "model_input.csv")print(fin.verify_recipe(saved.recipe_path, inputs_dir=DATA).message)print("\n".join(fp.describe(saved.recipe)))Reproduced: 6 steps from 2 inputs. Dropped 2 rows: 156 to 154 [cell 2] Filled gaps in tv by interpolation [cell 2] Merged with promo_calendar.csv (left join on 'week') (added promo, promo_name) [cell 2] Filled missing values [cell 2] Moved the index into columns [cell 2] Ran step add_seasonality(period_weeks=52) (added season_sin, season_cos, trend) [cell 2]
2. Fit a quick model (plain NumPy)
Section titled “2. Fit a quick model (plain NumPy)”Least squares of sales on each channel’s spend, with promo, season and trend as controls. A moving-block bootstrap (8-week blocks, so autocorrelation is respected) refits all channels together 1,000 times, which gives joint draws of every ROI.
df = fp.untrack(features)X = np.column_stack([np.ones(len(df)), df[CHANNELS + ["promo", "season_sin", "season_cos", "trend"]]])y = df["sales"].to_numpy()spend = df[CHANNELS].sum().to_numpy()

def roi(rows):    """ROI per channel over the fit window: the linear model's coefficient on each channel's spend."""    beta, *_ = np.linalg.lstsq(X[rows], y[rows], rcond=None)    return beta[1:1 + len(CHANNELS)]

rng = np.random.default_rng(7)starts = np.arange(len(y) - 8 + 1)blocks = [np.concatenate([np.arange(s, s + 8) for s in rng.choice(starts, len(y) // 8 + 1)])[:len(y)]          for _ in range(1000)]roi_draws = pd.DataFrame([roi(b) for b in blocks], columns=CHANNELS)point = roi(slice(None))
3. Say what the numbers mean
Section titled “3. Say what the numbers mean”The slide would say “TV ROI 1.37”. The estimand says which ROI: removing all spend on the channel, against zero spend, over the 154-week fit window, sales per gross dollar, the least-squares point with a 90% bootstrap interval.
roi_q = fin.estimand("roi", channels=CHANNELS, weeks=len(df), kpi="incremental_sales", cost_basis="gross", point_rule="estimator_point", interval="bootstrap_pct")roi_table = pd.DataFrame({ "channel": CHANNELS, "value": point, "lo": roi_draws.quantile(0.05).to_numpy(), "hi": roi_draws.quantile(0.95).to_numpy(), "current_spend": spend,})roi_table.round(3)| channel | value | lo | hi | current_spend | |
|---|---|---|---|---|---|
| 0 | tv | 1.372 | 1.257 | 1.499 | 5103140.505 |
| 1 | social | 2.200 | 1.952 | 2.422 | 1550867.080 |
| 2 | search | 2.968 | 2.686 | 3.331 | 1957347.190 |
The data is synthetic, so the true ROIs are known (1.4, 2.1, 2.8 in make_synthetic_data.py). Real data never
tells you this; here it shows the intervals are honest.
truth = {"tv": 1.4, "social": 2.1, "search": 2.8}fig, ax = plt.subplots(figsize=(6, 2.4))ax.hlines(range(3), roi_table.lo, roi_table.hi, lw=6, color="#5b8def")ax.plot(roi_table.value, range(3), "k|", ms=14, label="estimate")ax.plot([truth[c] for c in CHANNELS], range(3), "rx", label="true ROI (synthetic)")ax.set_yticks(range(3), CHANNELS)ax.set_xlabel("incremental sales per $1 (90% bootstrap interval)")ax.legend(fontsize=8, loc="lower right")plt.tight_layout()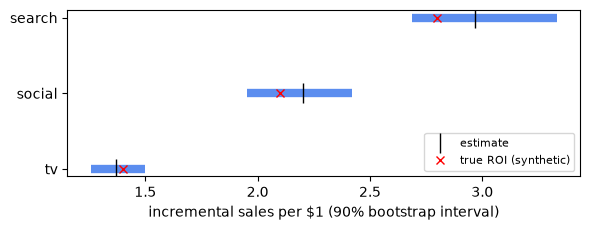
“What does media drive in total?” Because the bootstrap refit every channel at once, the draws are joint, and the total uses them with no dependence assumption.
fin.total(roi_draws * spend)details
| sum | lo | hi |
|---|---|---|
| independent | 1.489919e+07 | 1.772952e+07 |
| comonotone | 1.489919e+07 | 1.772952e+07 |
| reported | 1.489919e+07 | 1.772952e+07 |
4. Package it as a model
Section titled “4. Package it as a model”A results table is a Tier D model: summary numbers at current spend. Its acceptance status is untested, which
means usable with reduced trust (untested is not failed). It declares that its channel estimates are joint draws,
and it links the recipe that made its input.
model = fin.Model.from_table(roi_table, estimand=roi_q, name="Northwind quick OLS (synthetic data)", engine="notebook:numpy-ols", client="northwind-outdoor", dependence="joint_draws", recipe=saved)modeldetails
| engine | notebook:numpy-ols |
|---|---|
| dependence | joint_draws |
| acceptance | untested |
| estimands | roi: custom |
| channel | value | lo | hi | level | current_spend |
|---|---|---|---|---|---|
| tv | 1.37 | 1.257 | 1.499 | 0.9 | 5103140.505 |
| social | 2.20 | 1.952 | 2.422 | 0.9 | 1550867.080 |
| search | 2.97 | 2.686 | 3.331 | 0.9 | 1957347.190 |
model.check()details
| gate | outcome | message | codes |
|---|---|---|---|
| G-ACC-01 | fallback | acceptance untested: usable, labelled unvalidated method, trust reduced | UNVALIDATED_METHOD |
| G-CAP-01 | route | sandbox output: experimental label and a named approver needed | EXPERIMENTAL_LABEL |
model.save(OUT / "northwind_quick_ols.manifest.json")PosixPath('out/northwind_quick_ols.manifest.json')What you have now
Section titled “What you have now”out/model_input.csvwithout/model_input.recipe.json: the prepared data and how it was made, replayed and verified.uv run finprint show out/model_input.recipe.jsonprints the steps.out/northwind_quick_ols.manifest.json: the model’s numbers with their meaning attached, already through the gates.
Next: 04 · ump-core from a notebook files this model with ump-core.